Messing around with fine-tuning LLMs, part 6 -- measuring memory usage more systematically
My goal is to fine-tune an 8B model -- specifically, the Llama 3 8B base model -- on the openassistant-guanaco dataset, without using tricks like quantization or LoRA. I'm doing this as a way to try to understand how to do full-on multi-GPU training of a model that cannot be trained on just one GPU.
I've been building up to this goal gradually; so far, I've:
- Fine-tuned a 0.5B model on my own machine.
- Done the same, but in the cloud using Lambda Labs.
- Run some multi-GPU training, but using the GPUs to run larger batches for the 0.5B model -- which in turn means training faster -- rather than to train a larger model.
- Successfully fine-tuned the 8B model across multiple GPUs using ZeRO and DeepSpeed, but with the optimizer offloaded to CPU.
- Done some initial experiments into memory usage to find out why I had to offload the optimizer, using the 0.5B model locally.
The experiments I did last time around were to find out why, when the
DeepSpeed estimate_zero3_model_states_mem_needs_all_live function said that
I would need just less than 18 GiB of VRAM per GPU to train the 8B model without
offloading anything, in reality I needed 40 GiB and still had to offload the
optimizer.
At the end of the experiments, I'd found:
- At least part of the problem with the estimation function was that it did not take account of the sequence length being used for the training. In my very first post about fine-tuning, I'd found that the longer the sequence length, the more VRAM needed to tune (which makes perfect sense). My guess is that this is because the function is not designed for LLMs, but is rather for fixed-input models where the memory usage is more stable.
- The memory usage for PyTorch is classified two ways: the "allocated" memory, which is actually in use for tensors, and the "reserved" memory, which is the allocated memory plus -- at least, from my reading of the docs at the time -- whatever is used for caches.
- With a very short sequence length -- I had tested with it set to 10 -- the allocated memory in the train was closer to the results from the estimation function: in the case of the 0.5B model I was testing with locally, the function returned 8 GiB and the allocated VRAM was about 10 GiB.
- Some extra memory above the allocated amount was needed for training; my take on that was that caches were (understandably) important.
- However, it was possible to reduce the amount of reserved memory beyond the allocated (and to tell PyTorch to keep going even if it didn't have as much cache space as it wanted) if you set an environment variable:
export PYTORCH_CUDA_ALLOC_CONF=expandable_segments:True
This time around I wanted to take a more systematic look at the effects of the sequence length and of that environment variable on memory usage and training speed. I'd previously been assuming that VRAM usage would vary linearly with sequence length, but I had no evidence for that. And while it looked like training speed decreased with increasing sequence length, I didn't have any hard numbers. Time to fix that hole in my knowledge!
The first step: do some careful measurements of those numbers on the 0.5B model locally. That's what this post is about -- the next one will be for the 8B model running on Lambda Labs.
Building a measurement script
Once again, I did all of these experiments locally, using the 0.5B model. The first step was to write a simple program that would train a model and measure the high-water mark of memory usage for both allocated and reserved VRAM. I also wanted to measure the number of iterations per second.
In my experiments last time around, I'd noticed that VRAM usage seemed to plateau at the 25th iteration, so I decided to make my script run 29 iterations and then exit -- here's what it looked like:
import sys
import time

from datasets import load_dataset
import torch
from transformers import AutoModelForCausalLM, AutoTokenizer
from transformers import TrainingArguments, Trainer


class InterruptTraining(Exception):
    pass


class InterruptableTrainer(Trainer):
    END_ON_ITERATION = 30

    def training_step(self, model, inputs):
        step = self.state.global_step
        if step == 2:
            self.start_time = time.time()
        if step == self.END_ON_ITERATION:
            self.end_time = time.time()
            raise InterruptTraining()
        return super().training_step(model, inputs)

    def average_iterations_per_second(self):
        run_time = self.end_time - self.start_time
        return (self.END_ON_ITERATION - 1) / run_time


def tokenize_function(tokenizer, sequence_length, examples):
    tokenized = tokenizer(examples["text"], truncation=True, padding="max_length", max_length=sequence_length)
    tokenized["labels"] = tokenized["input_ids"][:]
    return tokenized


def main(sequence_length):
    dataset_source = "timdettmers/openassistant-guanaco"
    dataset = load_dataset(dataset_source)

    base_model = "Qwen/Qwen1.5-0.5B"
    tokenizer = AutoTokenizer.from_pretrained(base_model)
    model = AutoModelForCausalLM.from_pretrained(base_model)

    batch_size = 1
    args = TrainingArguments(
        'outputs',
        learning_rate=8e-5,
        warmup_ratio=0.1,
        lr_scheduler_type='cosine',
        fp16=True,
        evaluation_strategy="epoch",
        per_device_train_batch_size=batch_size,
        per_device_eval_batch_size=batch_size * 2,
        num_train_epochs=2,
        weight_decay=0.01,
        deepspeed="ds_config.json",
        report_to='none',
    )

    tokenized_dataset = dataset.map(
        lambda examples: tokenize_function(tokenizer, sequence_length, examples),
        batched=True
    )

    trainer = InterruptableTrainer(
        model, args,
        train_dataset=tokenized_dataset['train'],
        eval_dataset=tokenized_dataset['test'],
        tokenizer=tokenizer,
    )

    try:
        trainer.train()
    except InterruptTraining:
        pass

    stats = torch.cuda.memory_stats()
    active_peak_mib = int(stats["active_bytes.all.peak"] / (1024 * 1024))
    reserved_peak_mib = int(stats["reserved_bytes.all.peak"] / (1024 * 1024))
    with open("./results.csv", "a") as f:
        f.write(f"{sequence_length}, {active_peak_mib}, {reserved_peak_mib}, {trainer.average_iterations_per_second()}\n")


if __name__ == "__main__":
    main(int(sys.argv[2]))
You can see that it's taking the sequence length as the second command-line
parameter (more about that in a moment), loading up the dataset and the 0.5B
model, then running essentially the same train as we were before. The Trainer
subclass is used just to make sure that it craps out at the very start of the 30th iteration,
and to keep records of timing from the start of the 2nd iteration to the start of the 30th so that I
could get the iterations/second count. I felt it made sense to skip the first
iteration just to allow for any startup overhead.
(Looking at that code again now, I see that
I have an off-by-one error in the average_iterations_per_second function, but
that's not a big deal; it was relative numbers that I cared about for this set of
tests.)
The DeepSpeed JSON to go with this was just enough to set up ZeRO stage 3, to specify that we should use 16-bit parameters (doing it with DeepSpeed rather that in Transformers), and to provide a minimal set of other parameters that were compatible with the Transformers-side parameters, so it looked like this:
{
    "zero_optimization": {
        "stage": 3
    },
    "fp16": {
        "enabled": true
    },
    "optimizer": {
        "type": "AdamW",
        "params": {
        "lr": "auto",
        "betas": "auto",
        "eps": 1e-8,
        "weight_decay": "auto"
        }
    },
    "train_micro_batch_size_per_gpu": 1
}
Once it has run its curtailed train, the script then writes out the peak
allocated and reserved memory, and the measured iterations/second, to a results
file. The API call to get the numbers for the memory was actually
pretty easy to find,
and I double-checked that the numbers coming back were the same as the ones in the
human-readable output from the torch.cuda.memory_summary() function I'd been
using in my last experiment.
So with that, I had a script that could measure the allocated and reserved VRAM usage, and the iterations/second, for the first 29 iterations of a train over my dataset with a specified sequence length. A quick run with a few sample lengths gave results that were in line with the results from similar experiments in the last post.
Running it over a series of sequence lengths
Initially I was planning to wrap the code in the main function in that previous script in a loop over sequence lengths from
1 to 2048, with appropriate cleardown code at the end of each loop. But working
out the cleardown code was a bit tricky, and I realised that no matter what I did
I would always have a suspicion that there was something I was missing, and that
some kind of state -- caches, whatever -- was hanging around.
So, instead, I wrote a wrapper script that would run the script above iteratively from scratch, in a separate process each time. A little while into the first run, when it was doing the run with a sequence length of 300 or so, the train crashed hard with a core dump, which was interesting -- re-running with the same parameters worked fine, though. Perhaps a hardware issue? Either way, I decided to put in some retry logic, so the final script looked like this:
import subprocess

with open("./results.csv", "w") as f:
    pass

for sequence_length in range(1, 2049):
    succeeded = False
    tries = 0
    while not succeeded and tries < 5:
        tries += 1
        try:
            subprocess.check_call([
                "deepspeed",
                "measure_memory_usage_for_sequence_length.py",
                "--",
                str(sequence_length)
            ])
            succeeded = True
        except subprocess.CalledProcessError as exc:
            print(f"************************** ERROR {exc}")

    if not succeeded:
        print("***************** Too many failures, crapping out")
        break
You'll see that the sequence_length is actually being specified as the first of
the parameters for deepspeed to pass downstream to the script, but it appeared
that sys.argv[1] was being set to --local_rank=0 by the deepspeed script when
it kicked off my script, and the sequence length
went into the second one. So that's why I looked at
the second one in the other script.
Running the script
My plan was to run this twice, once with PYTORCH_CUDA_ALLOC_CONF unset, and
once with it set to expandable_segments:True. The first run was where I discovered
the issues with the core-dumping training runs, so it took about a day of elapsed time,
with 12 hours of actual run-time what with writing the retry loop, getting it wrong,
re-running stuff, and so on. (You'd think that with over 40 years' programming
experience I'd be able to get a retry loop working first time, wouldn't you...)
The second run, with the environment variable set, went more smoothly and took
10 hours running overnight. One thing that's clear from that is that I won't
be able to get this level of detail on Lambda Labs; the cheapest machine I can use
for the 8B model tests costs US$10/hour,
and I don't want to spend US$100 on a
simple test like this. However, I did a quick run of the same code but
with a step of 10 in the range function in the outer wrapper script; this
generated pretty much the same kind of data -- not as detailed, of course, but enough to get the high-level understanding
of how the various variables interact.
Just as a note -- all code to run this (including the charting code and the raw results) is in this GitHub repo.
So without further ado, let's have some charts!
Pretty pictures
Firstly, let's look at the results of the first train, where PYTORCH_CUDA_ALLOC_CONF was unset.
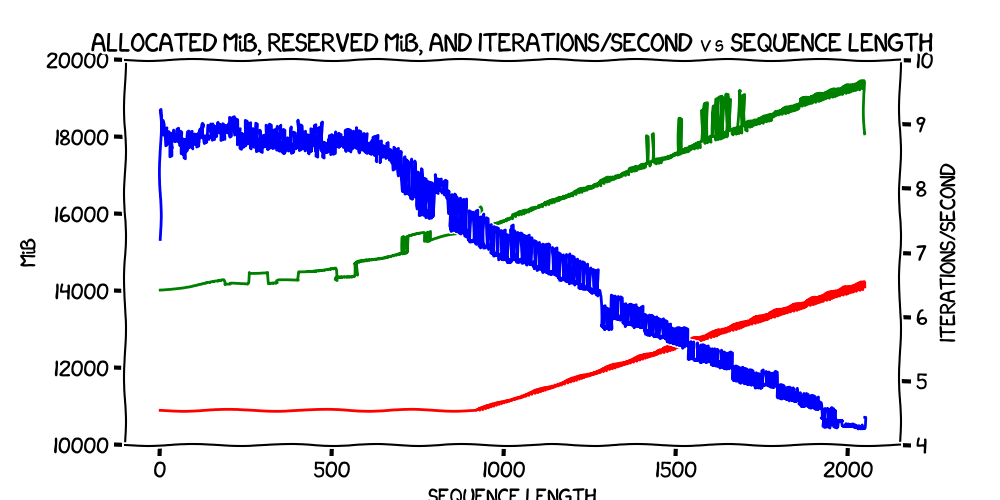
That's pretty clear.
- The allocated memory usage is completely flat until around iteration 900 (specifically, 917) and thereafter rises in a pretty much perfect straight line, with some fuzziness where it jumps up or down a bit.
- The reserved memory rises slowly up to about iteration 700, and then starts rising faster, on a line that (when the allocated memory starts going up) is pretty much parallel with the allocated memory.
- Iterations/second has a similar pattern where it's dropping very slowly initially and then, again at around iteration 700, starts falling more rapidly, but roughly linearly.
Now let's look at the results where PYTORCH_CUDA_ALLOC_CONF was set to
expandable_segments:True
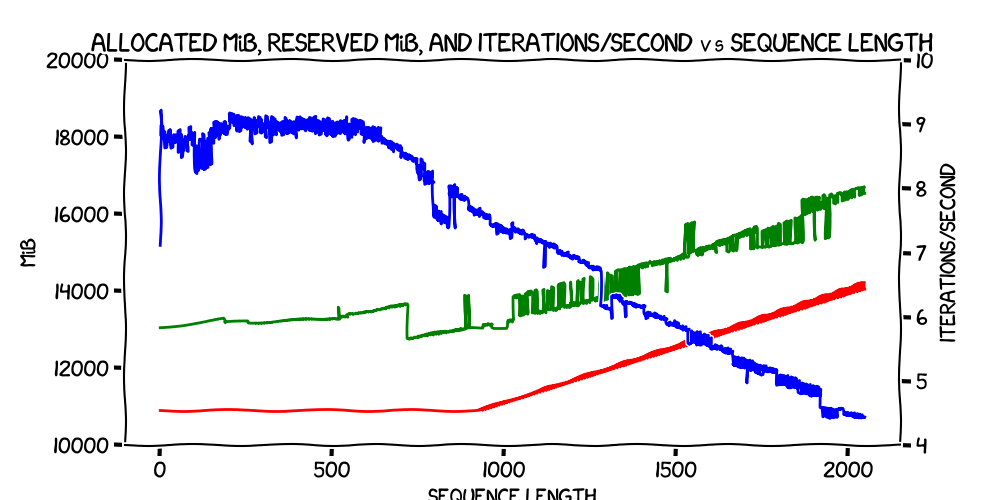
That looks very similar. Iterations/second and allocated memory usage are very close indeed, and reserved memory looks pretty similar, apart from that sudden drop at around iteration 750, and the fact that it's closer to the allocated memory throughout.
So what happens if we compare the measurements separately? Firstly, let's look at the allocated VRAM usage, both with the environment variable set and without:
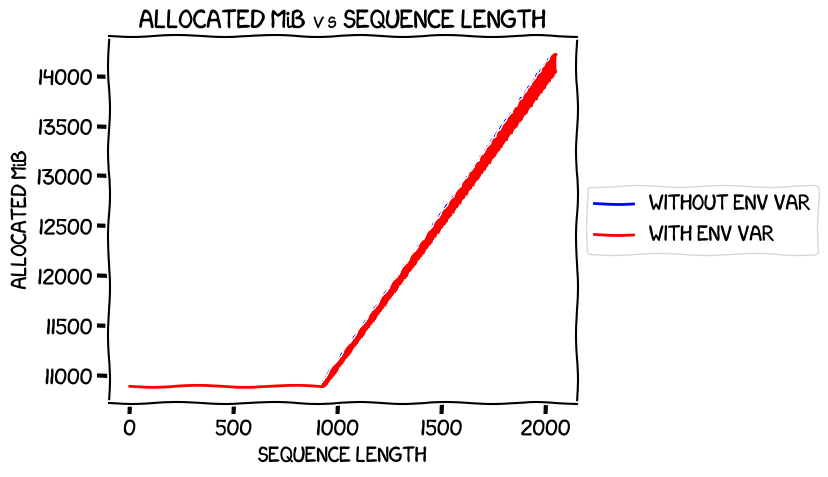
I must admit, when I first saw that chart I spent several minutes trying to work out why the "without env var" blue line wasn't showing. But if you look really closely, you'll see a few flecks of blue above and below the red in a few places. The blue line is invisible because it's almost perfectly covered by the red one, because the two are almost exactly the same -- which is what you'd expect, as these are the numbers for the allocated memory usage -- the two runs differ only in the setting of an enviroment variable that I believed at the time only affects caching. The space used by parameters, activations, gradients and so on would be the same between both runs, apart from any random variation caused by the training strategy.
With a little help from Claude 3.5 Sonnet I as able to get an approximation for the sloped line that takes off from the initial flat bit; the code it suggested to work it out was
import numpy as np

# Filter the dataframe to include only the data points after the flat segment
threshold = 918
linear_segment = without_df[without_df['Sequence length'] >= threshold]

# Extract x and y values
x = linear_segment['Sequence length'].values
y = linear_segment['Allocated MiB'].values

# Perform linear regression
a, b = np.polyfit(x, y, 1)

print(f"Linear approximation: y = {a:.4f}x + {b:.4f}")
...which came up with this:
Linear approximation: y = 2.9598x + 8163.2190
Interestingly, that constant term at the end -- which is what it evaluates to at
a sequence length of zero -- is pretty close to the 8.36 GiB that
was suggested by the estimate_zero3_model_states_mem_needs_all_live as the
expected VRAM usage of the model for training. Coincidence? Maybe.
But let's see how that looks when we plot the linear approximation (which, remember, was based purely on the numbers after sequence length 918) against the real numbers -- specifically the ones for the run without the environment variable, not that it matters much:
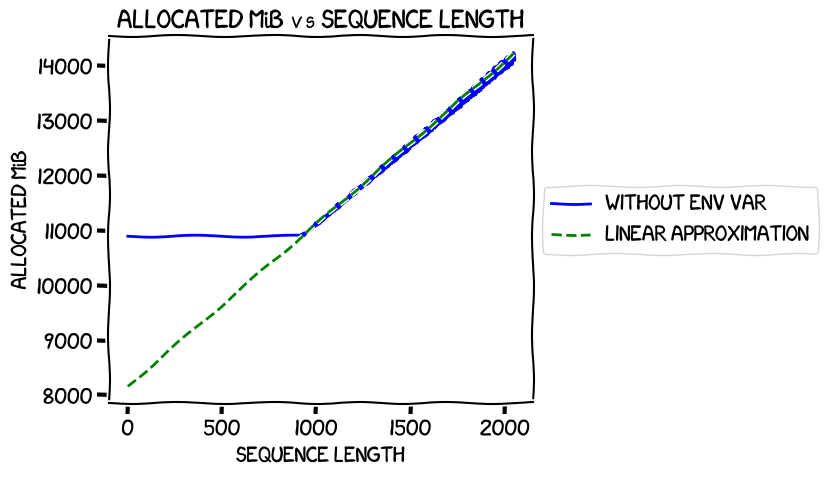
Looks solid.
Next, let's take a look at the reserved VRAM usage between the two runs:
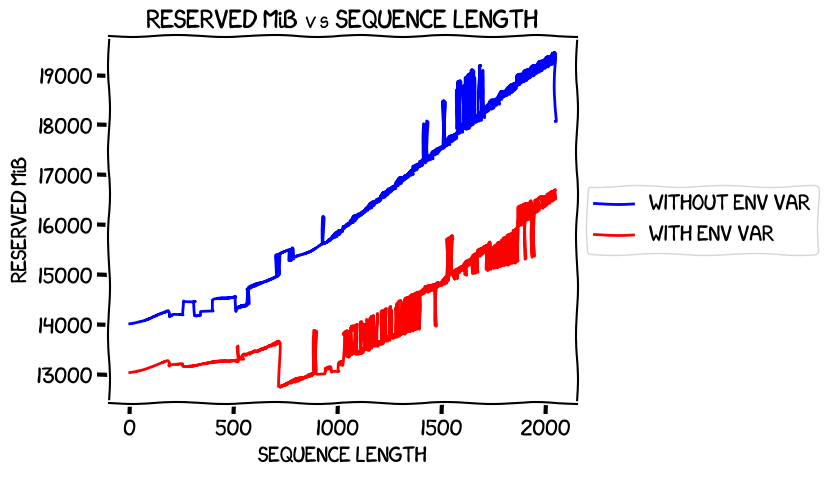
This, again, is pretty much as expected. Without the environment variable, as I'd seen in my less-systematic tests previously, VRAM usage is significantly higher -- and the effect seems to get worse the longer the sequence length. There is something strange going on with both of them at around iteration 700, though, as I noted earlier.
So, the question in my mind was, what was the cost in terms of performance of this reduction in memory usage? Here's the chart:
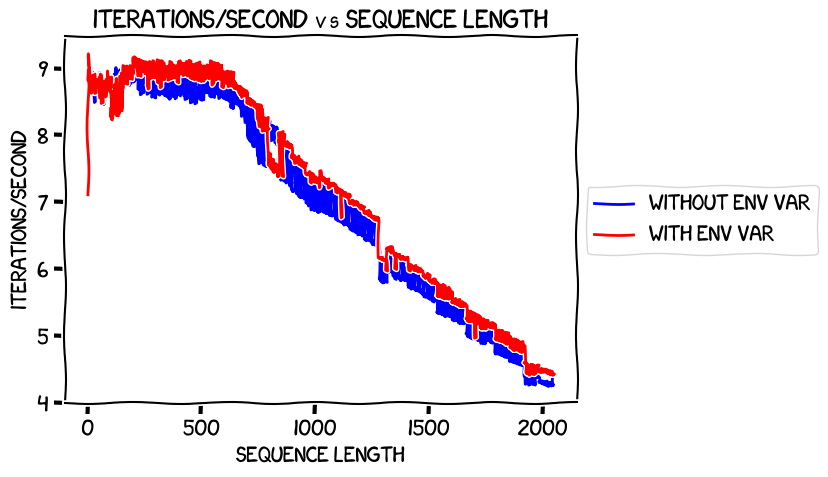
This one needed another double-take, and indeed a triple-take. Remember, higher on the Y axis is better in this chart -- it's more iterations per second. And, apart from the weirdness at around iteration 700, setting the environment variable led to higher speed in terms of training time at all sequence lengths above about 200, and essentially the same speed below that.
That really surprised me. I thought that the environment variable was effectively reducing the amount of caching that PyTorch did, and started hypothesizing: perhaps the value of the caches that setting the environment variable inhibits only really comes in later on in the train. Or perhaps the cache usage is optimized for different kinds of models, perhaps larger or smaller ones.
But perhaps it was time to actually read some docs :-)
What does this magic environment variable do, anyway?
So far I'd been setting PYTORCH_CUDA_ALLOC_CONF to expandable_segments:True
because that was what a PyTorch error message had told me to do, and not really
trying to understand it. I'd been interpreting the difference between the
reserved and allocated memory assuming that it was all essentially caches.
That was a deliberate choice; with so many unknowns in
my mind, I wanted to focus on the immediate ones and keep the others back for later
research. But these findings made me think that it was time to dig in on this one.
Luckily, it's well-documented.
The environment variable itself allows you to specify a number of options:
The format is
PYTORCH_CUDA_ALLOC_CONF=<option>:<value>,<option2>:<value2>...
One of the options is the max_split_size_mb that I tried setting in my last
set of experiments to no avail; it allows you to control fragmentation of the
allocated but currently unused memory. But expandable_segments is more interesting.
It's an experimental feature, and tells the allocator that when it allocates a lump
of memory, it should do so in a manner that it can be expanded in the future.
As far as I understand it from their description, not doing that makes things much easier for the allocator and is probably more efficient. But if the memory usage of your program varies wildly, with big allocations of varying sizes, then using this alternative system might be valuable.
Reading this also gave me what I think is a somewhat better understanding of reserved vs allocated memory. Going back to the summary I put together in the last post:
- The allocated memory is "the current GPU memory occupied by tensors in bytes for a given device."
- The reserved memory is "the current GPU memory managed by the caching allocator in bytes for a given device."
I'd read that as meaning essentially that the extra reserved memory beyond the
currently allocated was for caches. But a different, and I think better, reading
is that the reserved memory is the total amount of memory managed by PyTorch's memory allocator -- that is,
the the amount that PyTorch has
asked CUDA to provide. This memory then needs to be allocated out to the different
things that PyTorch is keeping track of, and of course there will always be wastage
due to fragmentation, not releasing memory in a timely fashion, and so on. It's the
same problem as (for example) malloc has to to when allocating RAM to
the process it's running inside -- it's just that here PyTorch is having to do it all for itself.
So, reserved minus allocated is essentially memory that has been requested from CUDA that is currently unused, perhaps because it can't be freed because it's part of a lump allocated a while back for something big that is now being used by one or more smaller things, with a bit of wasted space -- or perhaps because it's just being kept around in case something needs it soon.
I think I'm going to read into this a bit more, but at least that explanation goes some way towards explaining the performance results I saw. It's not that the environment variable makes PyTorch cache less -- instead, it makes it manage memory in a different way, which (as they say), might not be optimal for many deep learning models, but certainly seems to be better for this one.
A very useful lesson.
Next steps
The next obvious step is to run the same experiment with the 8B model. As I said earlier, this will have to be at a lower "resolution" than these, perhaps stepping the sequence length from 1 to 11 to 21, and so on, as otherwise it will be too expensive for a hobby project like this. But I think it should give some interesting results. I'm particularly interested in seeing if the iterations/second result -- where the alternative memory management algorithm leads to better performance and also lower VRAM usage -- happens there too.
And, of course, there will be some extra wrinkles -- with multiple GPUs I'll need
to measure memory usage across all of them. It doesn't look like that will be too
hard (torch.cuda.memory_stats takes a device parameter) but we'll have to see.
Until next time!