Messing around with fine-tuning LLMs, part 7 -- detailed memory usage across sequence lengths for an 8B model
My goal is to fine-tune an 8B model -- specifically, the Llama 3 8B base model -- on the openassistant-guanaco dataset, without using tricks like quantization or LoRA. I'm doing this as a way to try to understand how to do full-on multi-GPU training of a model that cannot be trained on just one GPU.
I've been building up to this goal gradually; so far, I've:
- Fine-tuned a 0.5B model on my own machine.
- Done the same, but in the cloud using Lambda Labs.
- Run some multi-GPU training, but using the GPUs to run larger batches for the 0.5B model -- which in turn means training faster -- rather than to train a larger model.
- Successfully fine-tuned the 8B model across multiple GPUs using ZeRO and DeepSpeed, but with the optimizer offloaded to CPU.
- Done some initial experiments into memory usage for a 0.5B model locally to get some ideas as to why I had to offload the optimizer.
- Measured memory usage more systematically for the 0.5B model, also locally, to find out how it behaves with different sequence lengths.
My tentative conclusion from the last post was that perhaps the function I was using
to estimate per-GPU memory usage, estimate_zero3_model_states_mem_needs_all_live,
might be accurate with a sequence length of 1. Right back at
the start of these experiments, I'd realised that the
sequence length is an important factor when
working out RAM requirements, and the function didn't take it as a parameter --
which, TBH, should have made it clear to me from the start that it didn't have
enough information to estimate numbers for fine-tuning an LLM.
In my last experiments, I measured the memory usage when training the 0.5B model at different sequence lengths and found that it was completely flat up to iteration 918, then rose linearly. Graphing those real numbers against a calculated linear approximation for that second segment gave this ("env var" in the legend refers to the environment variable to switch on expandable segments, about which much more later -- the blue line is the measured allocated memory usage):
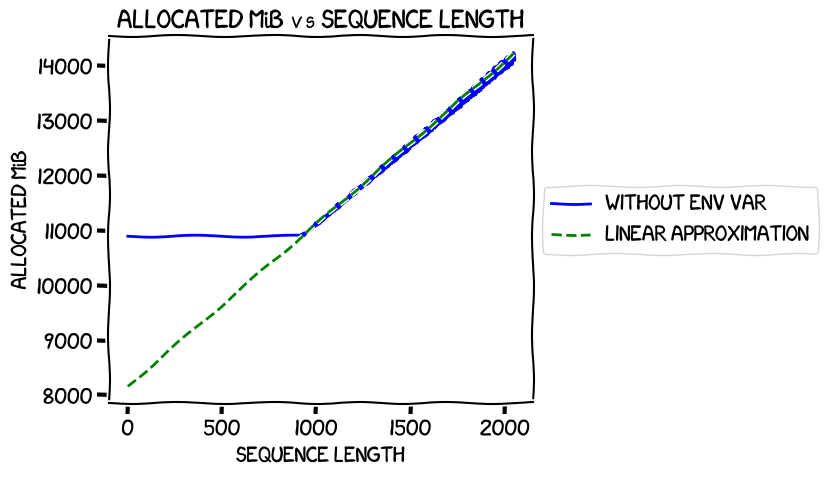
It intersected the Y axis at around 8 GiB -- pretty much the number estimated
by estimate_zero3_model_states_mem_needs_all_live.
So, this time around I wanted to train the 8B model, and see if I got the same kind of results. There were two variables I wanted to tweak:
- Expandable segments. Setting the environment variable
PYTORCH_CUDA_ALLOC_CONFtoexpandable_segments:Truehad reduced the memory usage of the training quite significantly. After some initial confusion about what it did, I had come to the conclusion that it was a new experimental way of managing CUDA memory, and from the numbers I was seeing it was a good thing: lower memory usage and slightly better performance. I wanted to see if that held for multi-GPU training. - Offloading the optimizer. I had needed to do that for my original successful fine-tune of the 8B model because not doing it meant that I needed more than the 40 GiB I had available on each of the 8 GPUs on the machine I was using. What was the impact of using it on memory and performance?
So I needed to run four tests, covering the with/without expandable segments and with/without optimizer offload. For each test, I'd run the same code as I did in the last post, measuring the numbers at different sequence lengths.
Here's what I found.
Writing the code
I started with the same code as I had used for testing the 0.5B model last time around; I won't explain the details of how that works as I covered it fully then. However, there were a few changes:
- Obviously, I had to change which model I was using, from Qwen/Qwen1.5-0.5B to meta-llama/Meta-Llama-3-8B
- I changed the loop in my outer
measure_memory_usage.py, which runs the per-sequence lengthmeasure_memory_usage_for_sequence_length.pyscript using DeepSpeed in a subprocess, so that it would use a step of 10 -- that is, instead of running it for every sequence length between 1 and 2048, I'd measure at 1, 11, 21, and so on. This would be to save costs; my training runs last time around had taken 12 hours or so, and given that I'd be using cloud servers from Lambda Labs that cost at least $10/hour, that would be way too expensive. I figured that measuring every ten would reduce the costs by a factor of 10, which would be more affordable. (This turned out to be not quite right). - I needed to measure the memory usage for all 8 GPUs; this turned out to be pretty
simple -- the
torch.cuda.memory_statsfunction I had used last time around takes adeviceparameter, which is just the integer number of the GPU you want to measure for, from 0 to 7 in this setup. - I also needed to add a pad token to the tokenizer, something I'd noticed in my first tune of the 8B model
The code is in this directory in the GitHub repo. Now it was time to run it.
Without optimizer offload
Without optimizer offload, no expandable segments: the code
When I looked at what instance sizes were available on Lambda Labs to run the code, I found that the 8x 40GiB A100 instances were unavailable. That was a bit annoying, as they cost $10.32/hour and were what I was used to using. However, I saw that they did have 8x 80GiB A100 instances at $14.32, and on reflection I realised that those would be much better. My previous fine-tune of the 8B model had needed to offload the optimizer, and I'd been thinking that I would only be able to fit in measurements for shorter sequence lengths without that offload. But it seemed likely that I'd be able to train all the way up to 2,048 sequence lengths with 80GiB per GPU, which would be excellent. I started one up, logged in, then:
git clone https://github.com/gpjt/fine-tune-2024-04.git
cd fine-tune-2024-04
sudo apt install -y virtualenvwrapper
source /usr/share/virtualenvwrapper/virtualenvwrapper.sh
mkvirtualenv fine-tune
pip install -r requirements.txt

export HF_TOKEN=XXXXXXXXXXXXX

cd sequence-length-memory-modeling-8B/
deepspeed --num_gpus=8 measure_memory_usage.py
If you've been following along closely you might see the mistake I made with that, but I didn't. It took a few minutes to download the model, and then suddenly the machine went crazy -- load average of more than 10,000 and all 240 CPU cores were massively loaded. And nothing was going to the GPUs yet.
Luckily I realised the mistake before I wasted too much time and money debugging --
the script measure_memory_usage.py is just a wrapper that then runs deepspeed
with the appropriate command-line arguments to measure each sequence length, so
I should have run it with python rather than deepspeed. Note to self: using
deepspeed to run something that then tries to run deepspeed leads to an explosion
of processes -- one per GPU for the top-level one, each of which spawns one per
GPU. 8 + 8 * 8 = 72 doesn't sound like a lot of processes, but if they're all trying
to run an LLM training loop, the machine doesn't like it.
Fixed that, and it started training properly. Phew!
The next thing was to see if
my step of 10 -- that is, measuring at sequence lengths of 1, 11, 21, and so on --
would mean that I could run my test script in a reasonable amount of time, and without
breaking the bank. Using nvtop to monitor GPU memory usage, I started a timer
when it dropped to zero after the first test (with sequence length 1), and then waited for dropoff at
the end of the second (sequence length 11). It was 2m58s. At US$14.32/hour, that
meant that it was costing $0.71 per measurement. With the
200 data points I was trying to gather, that's a total cost of $142. That was a bit
more than I wanted to spend, to say the least, espectially as I'd be running four
tests like this.
I decided to confirm that I was at least getting usable data, and then reconsider the strategy.
The file looked like this; the first column was the sequence length, the next two the active and reserved memory for GPU0, then next two the memory for GPU1, and so on for the rest of the GPUs, and the last column was the iterations/second.
1, 0, 0, 0, 0, 0, 0, 34593, 44008, 0, 0, 0, 0, 0, 0, 0, 0, 1.5474389773033035
1, 34705, 43896, 0, 0, 0, 0, 0, 0, 0, 0, 0, 0, 0, 0, 0, 0, 1.5475324742804955
1, 0, 0, 0, 0, 33377, 43896, 0, 0, 0, 0, 0, 0, 0, 0, 0, 0, 1.5474429146192135
1, 0, 0, 0, 0, 0, 0, 0, 0, 0, 0, 0, 0, 0, 0, 33265, 43896, 1.5475088282627358
1, 0, 0, 0, 0, 0, 0, 0, 0, 0, 0, 34369, 43896, 0, 0, 0, 0, 1.5474801232439028
1, 0, 0, 0, 0, 0, 0, 0, 0, 0, 0, 0, 0, 33153, 43896, 0, 0, 1.5476783434626564
1, 0, 0, 0, 0, 0, 0, 0, 0, 33153, 43896, 0, 0, 0, 0, 0, 0, 1.5473792309932763
1, 0, 0, 34481, 44008, 0, 0, 0, 0, 0, 0, 0, 0, 0, 0, 0, 0, 1.547444824224645
11, 0, 0, 0, 0, 34848, 46970, 0, 0, 0, 0, 0, 0, 0, 0, 0, 0, 1.2525151099569578
11, 34848, 46970, 0, 0, 0, 0, 0, 0, 0, 0, 0, 0, 0, 0, 0, 0, 1.2525078744594635
11, 0, 0, 33104, 44966, 0, 0, 0, 0, 0, 0, 0, 0, 0, 0, 0, 0, 1.2524346471590182
11, 0, 0, 0, 0, 0, 0, 0, 0, 34603, 46970, 0, 0, 0, 0, 0, 0, 1.2523149973727445
11, 0, 0, 0, 0, 0, 0, 0, 0, 0, 0, 0, 0, 0, 0, 34592, 46970, 1.2524749739912961
11, 0, 0, 0, 0, 0, 0, 34667, 46970, 0, 0, 0, 0, 0, 0, 0, 0, 1.2525562029774542
11, 0, 0, 0, 0, 0, 0, 0, 0, 0, 0, 33362, 44966, 0, 0, 0, 0, 1.252441688369528
11, 0, 0, 0, 0, 0, 0, 0, 0, 0, 0, 0, 0, 34829, 46970, 0, 0, 1.2524591885707919
21, 0, 0, 0, 0, 34827, 45036, 0, 0, 0, 0, 0, 0, 0, 0, 0, 0, 1.594006343613614
21, 0, 0, 33166, 45036, 0, 0, 0, 0, 0, 0, 0, 0, 0, 0, 0, 0, 1.5939153135991027
21, 0, 0, 0, 0, 0, 0, 0, 0, 0, 0, 34827, 45036, 0, 0, 0, 0, 1.5937607660252013
21, 0, 0, 0, 0, 0, 0, 34827, 46038, 0, 0, 0, 0, 0, 0, 0, 0, 1.5938529688427776
21, 0, 0, 0, 0, 0, 0, 0, 0, 0, 0, 0, 0, 0, 0, 34827, 46150, 1.5938958473089628
21, 0, 0, 0, 0, 0, 0, 0, 0, 34827, 46038, 0, 0, 0, 0, 0, 0, 1.593867609501465
21, 0, 0, 0, 0, 0, 0, 0, 0, 0, 0, 0, 0, 34827, 46038, 0, 0, 1.5937763447330542
21, 34827, 46038, 0, 0, 0, 0, 0, 0, 0, 0, 0, 0, 0, 0, 0, 0, 1.5936437057463826
31, 0, 0, 0, 0, 0, 0, 0, 0, 36761, 47446, 0, 0, 0, 0, 0, 0, 1.26776624887729
31, 0, 0, 0, 0, 0, 0, 36761, 47414, 0, 0, 0, 0, 0, 0, 0, 0, 1.2677662753044487
31, 0, 0, 0, 0, 0, 0, 0, 0, 0, 0, 0, 0, 36761, 47446, 0, 0, 1.2677569862260212
31, 0, 0, 36761, 47446, 0, 0, 0, 0, 0, 0, 0, 0, 0, 0, 0, 0, 1.2677561141431444
31, 33118, 46108, 0, 0, 0, 0, 0, 0, 0, 0, 0, 0, 0, 0, 0, 0, 1.267771851459585
31, 0, 0, 0, 0, 0, 0, 0, 0, 0, 0, 36761, 46332, 0, 0, 0, 0, 1.267701003581731
31, 0, 0, 0, 0, 36761, 47334, 0, 0, 0, 0, 0, 0, 0, 0, 0, 0, 1.267678701748304
31, 0, 0, 0, 0, 0, 0, 0, 0, 0, 0, 0, 0, 0, 0, 32628, 45106, 1.267746798787272
That was interesting; I had expected my code at the end of measure_memory_usage_for_sequence_length.py
to write one line for each sequence length, with all of the GPUs in that line.
But on reflection, it made sense. DeepSpeed was spinning off one process per
GPU for the training, and on exit, each of them was writing its own line to the
file, with just the memory usage for that specific GPU. Not a problem -- it looked like something
I could easily normalize when analysing the data later,
The numbers for memory usage looked pretty solid, anyway, and matched the kind of
thing I was seeing in nvtop, so I decided to do the full run. However, to bring
the costs down to something more managable, I increased the step to 100. As I
already had data up to 31 and didn't want to throw that away, I deleted the code
that wiped the results file at the start of measure_memory_usage.py, then changed
the start point of the sequence length loop to 41, made the change to the step, and
kicked it off again.
This finished after 2 hours total uptime, at a cost of $28.55. I downloaded the results file and terminated the instance.
Now it was time for a bit of data analysis.
Without optimizer offload, no expandable segments: the charts
All of this analysis is in this notebook in the GitHub repo.
The first thing was to load the data into a pandas dataframe, and then to check
it. Claude was amazingly helpful here. I first asked
it to write a function called validate_gpu_allocation that would confirm to me
that for each sequence length, there was a line for every GPU. While I could
have written it myself, it was much easier to scan through the AI-generated code
for any glaring bugs. It looked fine, and the data passed that check.
I then got it to write a function normalize_gpu_data to convert the input
dataframe into one with one line per sequence length, combining all of the different
GPU memory usages, and to use the mean iterations/second number (there was a small
variation in the numbers reported by each DeepSpeed process for any given sequence
length, but from a scan of the data it didn't look like anything I needed to worry about).
With that done, I asked for a function to add on max, min and mean numbers across
all GPUs for each of the two memory usage measurements, allocated and reserved.
add_gpu_summary_stats was the result. Once again, a quick sanity check
looked good.
Finally, I asked it to plot the max, min and mean allocated and reserved GPU usage
and the iterations per second. I was actually really impressed with the result;
although I'd asked for separate lines for the max/min/means, it decided to use
PyPlot's fill_between function to generate a nice coloured range -- a feature
that I had no idea existed. Claude is definitely my go-to for data analysis now.
Here's how it looked:
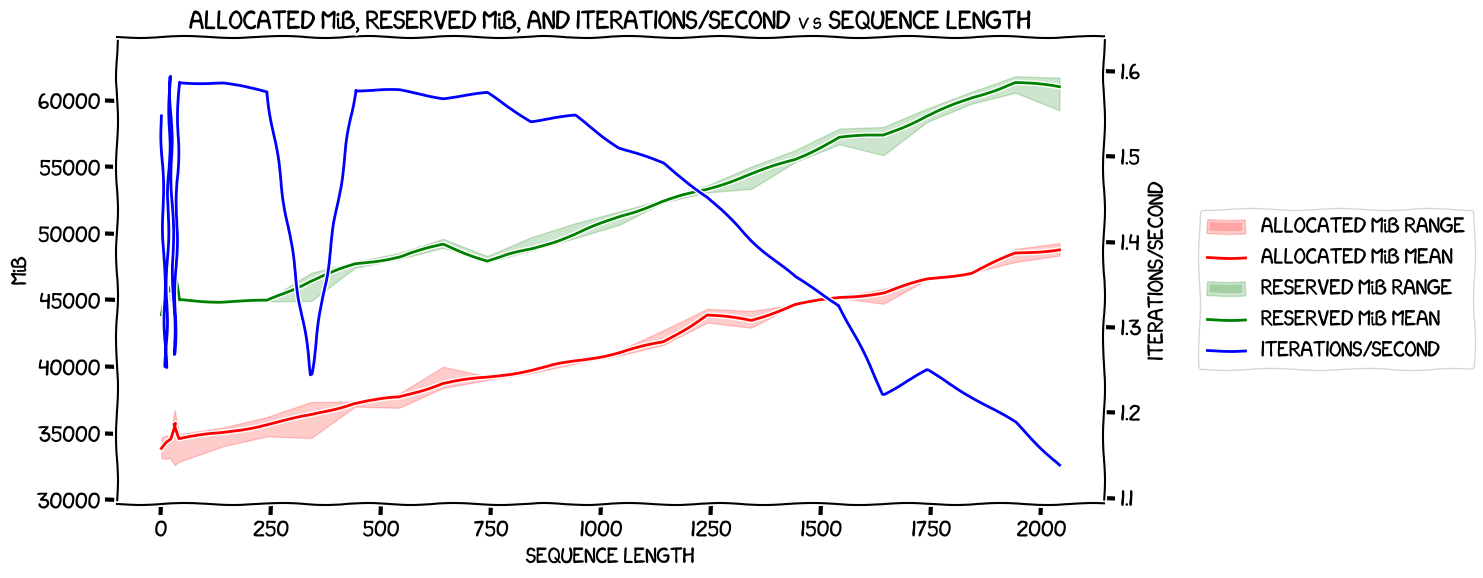
That was interesting, and kind of blew out of the water my theory that
estimate_zero3_model_states_mem_needs_all_live worked for a sequence length of
one. It had said that I needed just less than 18 GiB of VRAM
per GPU to train the 8B model without offloading anything. But even with a
sequence length of one, there was an allocated usage of about 34 GiB -- and this
wasn't due to a flat section at the start of the graph like it was with the 0.5B model -- it started going up
pretty much linearly straight away.
Apart from that, there didn't seem to be anything crying out for immediate analysis -- the big dropoff in iterations per second at 341 I figured was just noise, and likewise the smaller one at 1641.
Time to move on to the next run.
Without optimizer offload, with expandable segments
I spun up the same size of machine again, and ran exactly the same code, but
this time with the range in measure_memory_usage.py set to 1 to 2049 in steps
of 100, and setting the environment for expandable segments:
export PYTORCH_CUDA_ALLOC_CONF=expandable_segments:True
It ran for about 1h45m, costing $20.91, and the results were:
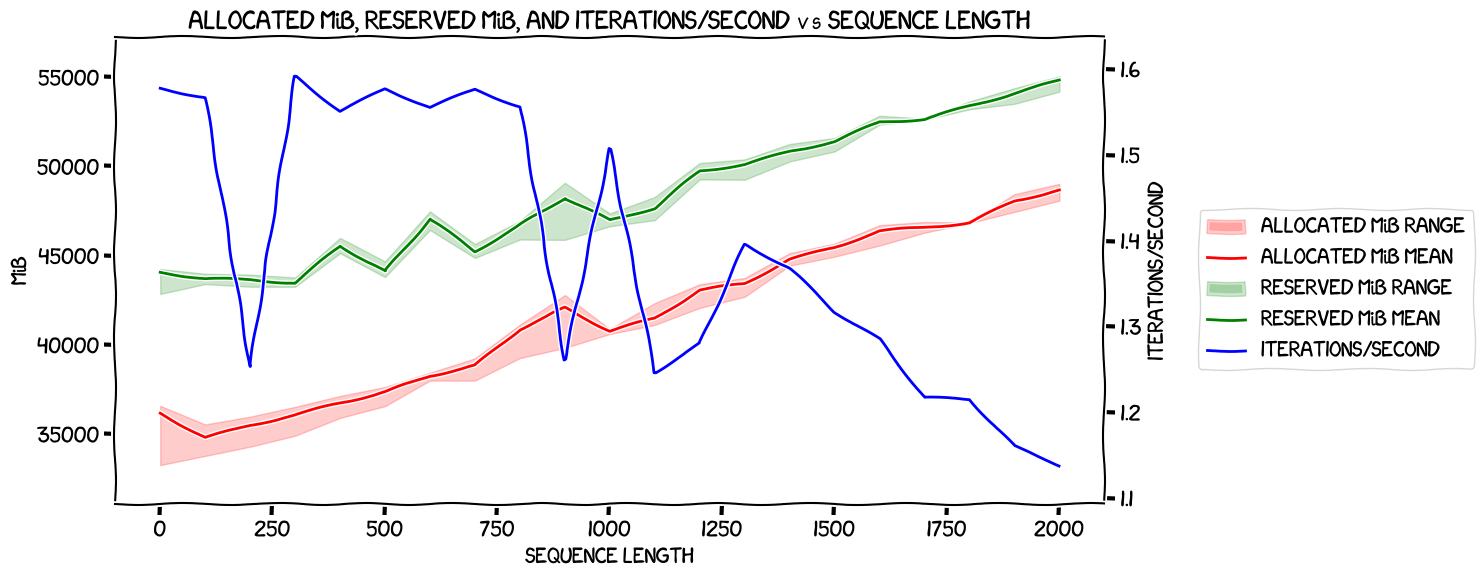
Once again, some noise in the iterations per second, but a general decrease in speed as the sequence length got longer, and nothing too surprising in memory usage -- the allocated memory was within the same ballpark as the run without expandable segments, and the reserved memory looked lower.
Time to see how the two runs compared against each other.
Without optimizer offload: comparison
Firstly, how did iterations per second compare between the run without and with expandable segments?
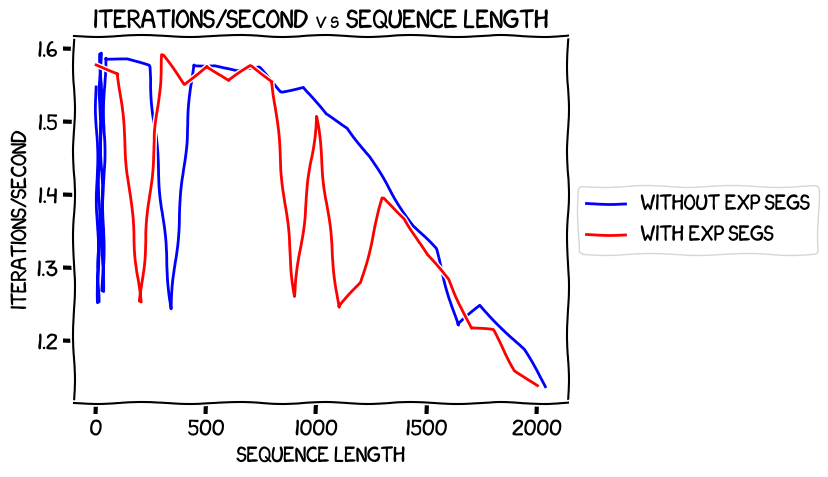
In the previous post where I was measuring things locally with the 0.5B model, I found that expandable segments were a bit faster. It was much less clear here. Using expandable segments seemed to lead to more anomolies in the speed of training, but beyond that the graphs look pretty much the same. Given that there were so few data points this time round -- only 21 as opposed to 2,000 -- I'm not sure how much to read into this. My gut is saying that it's pretty much a wash in terms of speed, and there's just a lot of noise.
Next, allocated memory. I decided to plot the maximum allocated across all GPUs for each sequence length, because it's the maximum that would limit what one could do at any given length with GPUs of a given size. It looked like this:
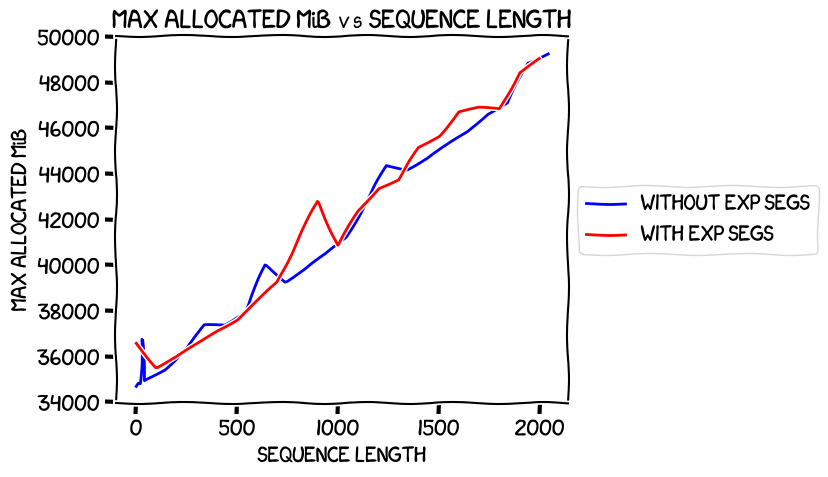
Essentially the same; they weren't as close to exactly the same as they were with single-GPU training previously, but close enough.
How about max reserved memory?
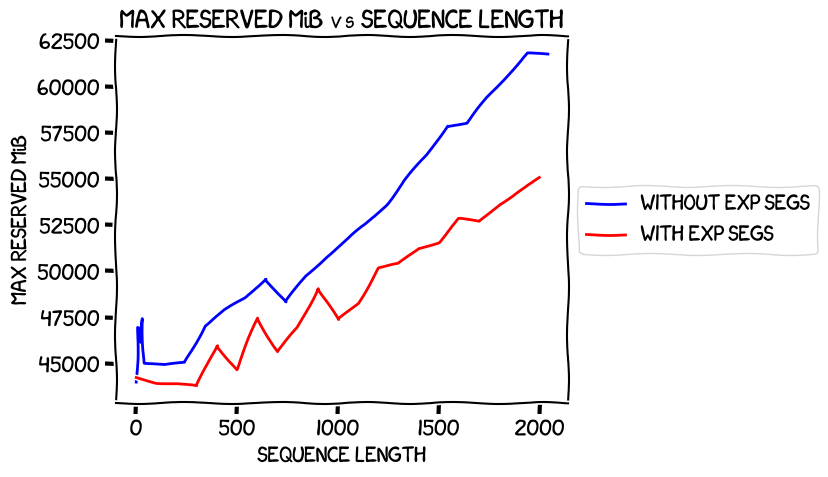
Pretty much as expected; expandable segments help, and it looks like they help more the longer the sequence length.
So, my conclusion here: using expandable segments seems to make the speed a little more variable, but in general looks like a pretty much zero-cost way of using less memory. And using less memory is really valuable because it increases the batch size you can run with -- remember that all of these experiments were with a batch size of one, and a batch size of two would halve training time.
And that is a pretty good segue into the next set of measurements. The optimizer offload that I had to do in my earlier successful fine-tune of the 8B model had made things run very slowly. But it saved enough memory that I could run the fine-tune with a batch size of 4 -- without it, I couldn't run the fine-tune at all with the memory I had. All other things being equal, something that can run with a batch size of 5 at (say) 2 iterations/second will train faster than something that can run with a batch size of one at 9 iterations/second.
So, what was the memory usage and performance like with the optimizer offloaded?
With optimizer offload
For this I just took copies of my existing measure_memory_usage.py,
measure_memory_usage_for_sequence_length.py, and the associated DeepSpeed JSON
configuration file ds_config.json, appended _optimizer_offload to their filenames,
and made the appropriate tweaks: the top-level script just needed to call the
different for_sequence_length script when it used subprocess to kick it off
with DeepSpeed, the lower-level script just gained a
model.gradient_checkpointing_enable()
...and used the different JSON file, and the JSON file switched to ZeRO stage 2
and gained an offload_optimizer section. You can see the code in
the repo.
So, time to spin up some instances and run it.
With optimizer offload, without expandable segments
Exactly the same process as before, just with a slightly different script to run,
and no PYTORCH_CUDA_ALLOC_CONF environment variable. It hung completely just
as it was finishing its run with the sequence length of 101 -- that is, the
second data point. It had written the data to the results file, but DeepSpeed
just didn't seem to be shutting down its subprocesses. A control-C fixed that,
and I was able to kick it off again (just doing the lengths it hadn't already done,
appending to the existing file). That time it ran through to completion.
Because it took me a while to notice that it had hung, this ran for almost three
hours, so a cost of $40.29.
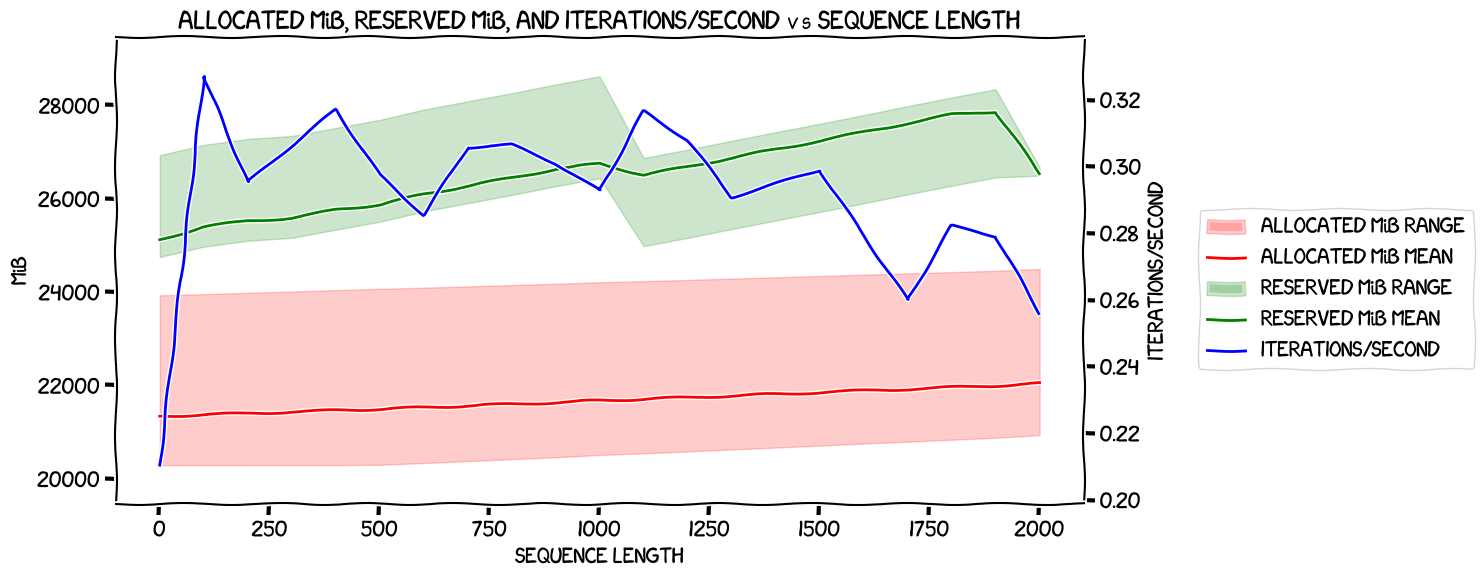
So, some weirdness with speed at the start but it seemed to follow a reasonably simple declining rate after that. Memory usage looked lower (graphs further down) but noticeably much more variable -- a good few GiB difference between the GPU with the lowest usage and the one with the highest.
With optimizer offload, with expandable segments
Next with the expandable segments; same code, but with
export PYTORCH_CUDA_ALLOC_CONF=expandable_segments:True
This one ran until it was doing sequence length 1801, and then it hung, just like last time. Again, I tweaked the script to start at 1901 and to append to the existing results, and got those last two measurements in. About 2h30m, $35.50.
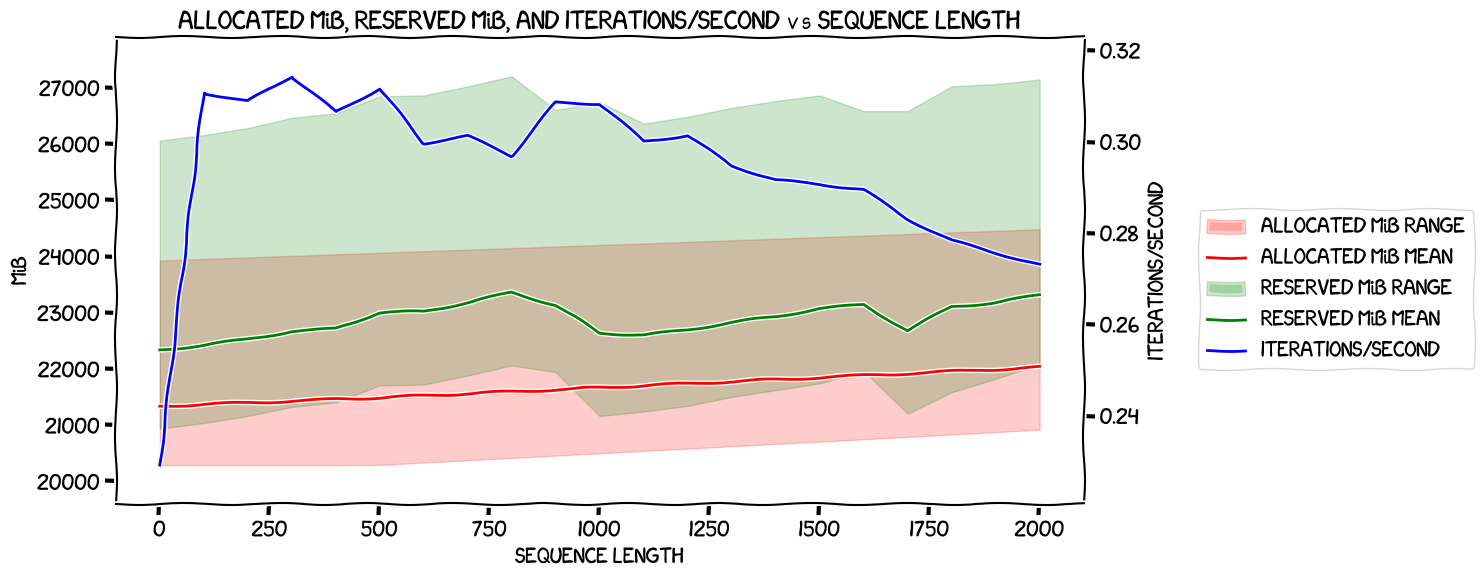
Again, huge variation in both allocated and reserved memory usage across the GPUs, to the extent that the highest allocated memory is higher than the lowest reserved at all sequence lengths. Also a very slow speed at sequence length one, but a fairly straight decline from 101 to the end. And lower memory usage than the non-expandable-segment version, as expected. Time for some plots...
With optimizer offload: comparison
Once again, we start with the speed comparison:
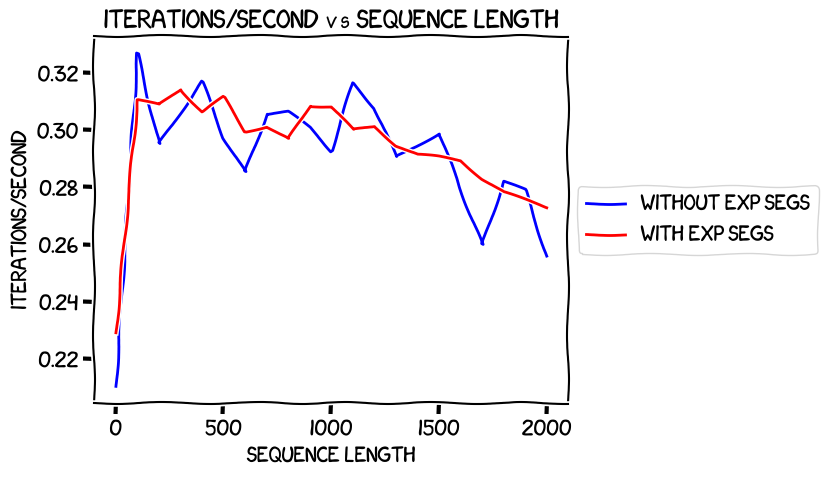
Both of them showed a strangely-slow speed at a sequence length of 1, and then they were pretty similar after that. Again, it didn't look like expandable segments have a cost in terms of performance.
Allocated memory (again, max across all GPUs):
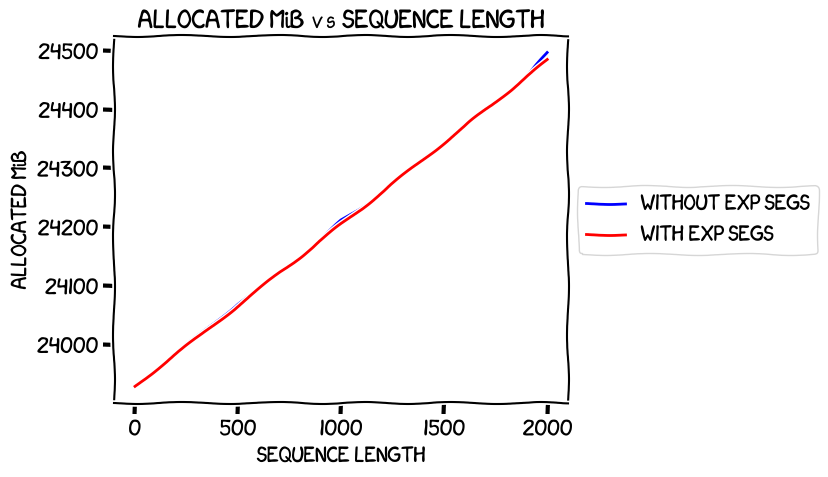
Nice and straight, almost exactly the same, as expected, and much more similar than in the non-optimizer-offload case.
Max reserved memory:
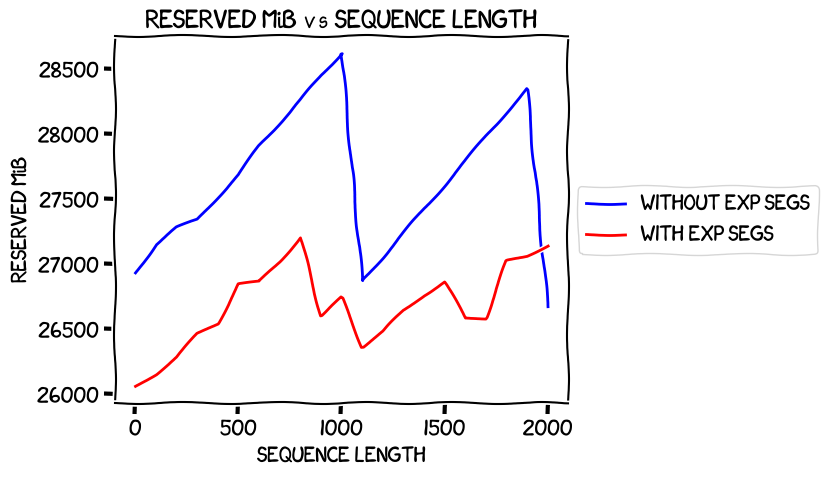
Now that was a weird one. There's that sudden dropoff at a sequence length of 901 for the expandable segments one, continuing until 1101, and that even larger one at 1001 for non-expandable segments -- and the crazy one at 2001, which brings the non-expandable segments memory usage below that with expandable segments.
I think what I'm taking away from this is that offloading the optimizer makes stuff a bit weird. Not sure how much use that is, though...
Comparing with and without the optimizer offload
My general feeling at this point was (with the exception of that weird last data point in the last comparison graph), using expandable segments for this kind of fine-tuning was pretty much a no-brainer. It was also clear that offloading the optimizer slowed things down but used less memory. But how big was the memory saving? Would it make sense to use it so as to be able to use larger batch sizes? I didn't have enough data at this point to work that out, but from the data that I had I was able to graph a few things.
Firstly, speed vs sequence length with expandable segments, with and without offload:
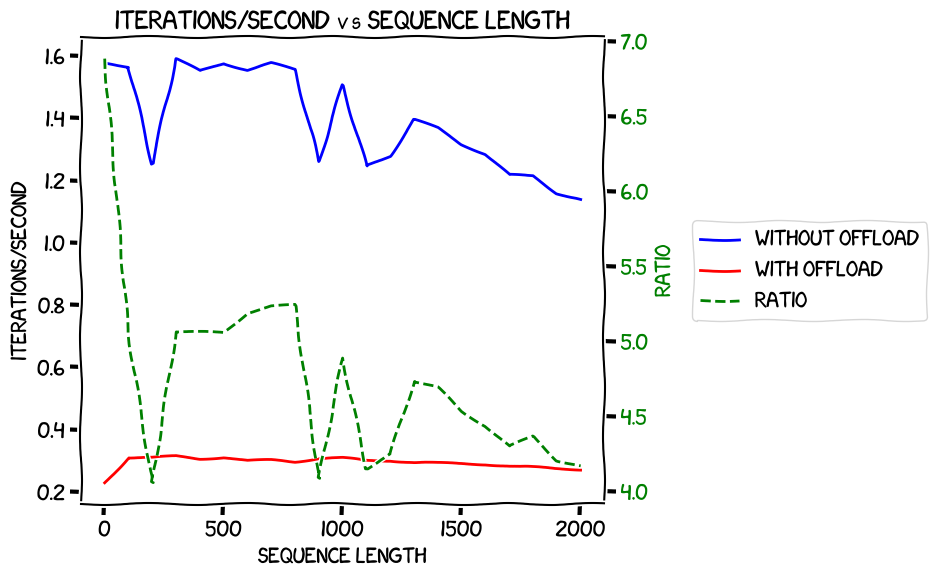
There's a lot of noise in there, but it looks like the benefit of not optimizing the offload declines as the sequence length gets longer.
Then max allocated VRAM with expandable segments, with and without offload:
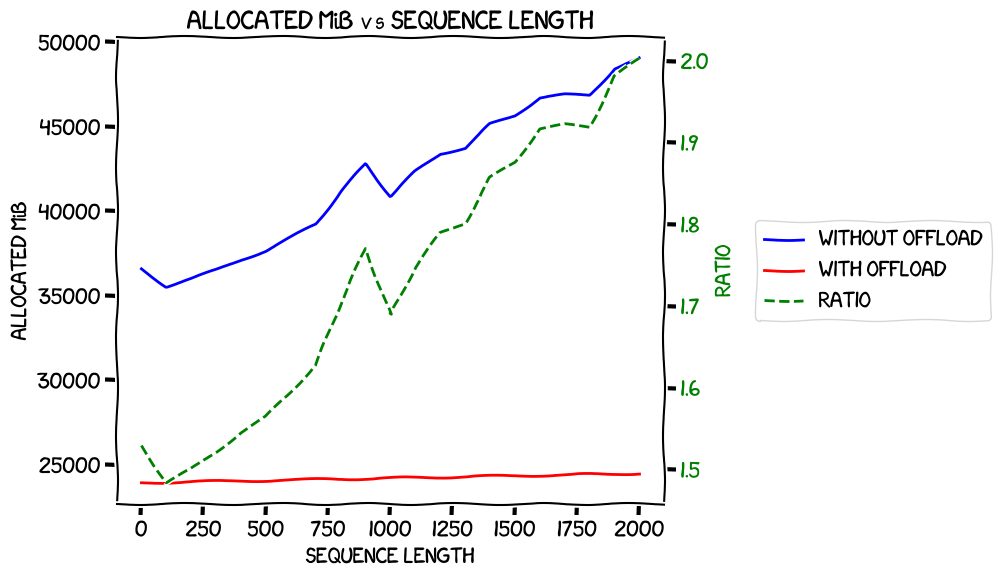
Again, this looks like memory usage gets larger at a faster rate without the optimizer offload.
Finally, max reserved VRAM with expandable segments, with and without offload:
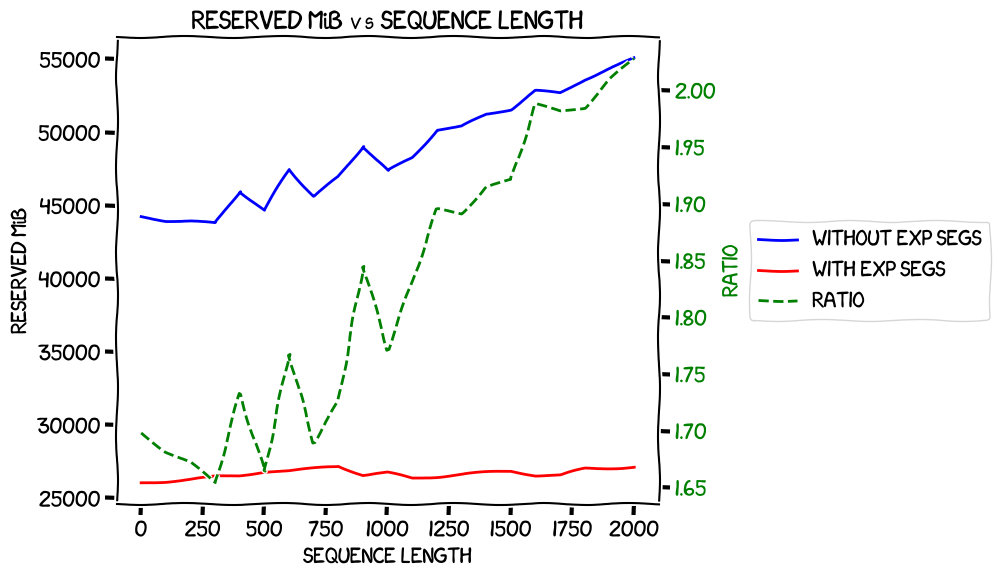
...which shows pretty much the same as the previous one.
Unfortunately, I think that working out the most efficient way to fine-tune this model will require more experiments. But for now, that's a good place to stop.
Conclusion and next steps
The total cost of all of these experiments was $125.25 -- significantly more than I was expecting! However, I think I learned some useful stuff:
- The match I saw with the 0.8B model, where training it with a sequence length
of 1 made it use the amount of memory predicted by
estimate_zero3_model_states_mem_needs_all_live, looks like it was just chance. Right now, I suspect that the only good way to work out how much memory a given model needs to train is to just try it. Perhaps I'll learn more later. - Using expandable segments seems to be a pretty much zero-cost way to reduce memory usage without any serious impact on iterations per second. I still would not have been able to train the 8B model on a sequence length of 2,000 by using it, though.
- Memory usage does seem to be pretty much linear with sequence length, regardless of whether the optimizer is offloaded.
- Offloading the optimizer saves a lot of memory -- and the longer the sequence length, the more it saves, even as a ratio between the amount used with and without. This applies to both the reserved and the allocated memory.
- It comes at a cost of a very large slowdown in iterations per second, which is particularly high at shorter sequence lengths, and even though it's smaller at longer lengths, it's still quite high.
- There also appeared to be an issue with the DeepSpeed subprocesses not exiting cleanly when the optimizer offloaded; that would be something to keep an eye out for.
I think that the next experiments I need to run will be to find out what batch sizes I can squeeze in to memory both with and without optimizer offload. I can fix the sequence length to the length I want to use for the full train -- 2048 -- and use expandable segments. Then I can run the code I already have to measure the memory usage with a batch size of one, with a batch size of two, and so on until the script crashes with an out-of-memory error. One run with the optimizer offloaded, with without, and we can find out which wins. A bit of maths to work out which one would train faster, and we're done.
Then I can do the train, and this series will be over. I'm sure you'll miss it!