Messing around with fine-tuning LLMs, part 8 -- detailed memory usage across batch sizes
This is the 8th installment in a mammoth project that I've been plugging away at since April. My goal is to fine-tune an 8B model -- specifically, the Llama 3 8B base model -- on the openassistant-guanaco dataset, without using tricks like quantization or LoRA. I'm doing this as a way to try to understand how to do full-on multi-GPU training of a model that cannot be trained on just one GPU -- so I'm taking it super-slowly and stopping and measuring everything along the way.
So far, I've:
- Fine-tuned a 0.5B model on my own machine.
- Done the same, but in the cloud using Lambda Labs.
- Run some multi-GPU training, but using the GPUs to run larger batches for the 0.5B model -- which in turn means training faster -- rather than to train a larger model.
- Successfully fine-tuned the 8B model across multiple GPUs using ZeRO and DeepSpeed, but with the optimizer offloaded to CPU.
- Done some initial experiments into memory usage for a 0.5B model locally to get some ideas as to why I had to offload the optimizer.
- Measured memory usage more systematically for the 0.5B model, also locally, to find out how it behaves with different sequence lengths.
- Made similar measurements for the 8B model.
I'd reached the conclusion that the only safe way to find out how much memory a fine-tune of either of the models I was working with would use was just to try it. The memory usage was important for three reasons -- firstly, whether the model could be trained at all on hardware I had easy access to, secondly, if it could be trained, whether I'd need to offload the optimizer (which had a serious performance impact), and thirdly what the batch size would be -- larger batches mean much better training speed.
This time around I wanted to work out how much of an impact the batch size would have -- how does it affect memory usage and speed? I had the feeling that it was essentially linear, but I wanted to see if that really was the case.
Here's what I found.
Testing with the smaller model, locally
I decided to start off by measuring the effect of the batch size on memory usage and speed with the 0.5B model, so that I could work any bugs out of the process locally. It was a pretty simple change to the code I wrote previously to measure the effect of sequence length, so I'll just link to it here -- as you can see, there are versions both with and without optimizer offload. As you might remember, the code kicks off a train with the given parameter -- batch size in this case -- and runs it for 30 iterations, then bails out and records the peak memory usage (both reserved and allocated) and the average iterations per second over those 30 iterations.
The only interesting thing was how to programatically change the batch size when using DeepSpeed; I previously had it specified in the JSON file and in the code, and wanted to only specify it in the code. It turned out that the trick was to set it to "auto" in the JSON:
"train_micro_batch_size_per_gpu": "auto"
With no optimizer offload, using expandable segments memory management (which I'd previously decided appeared to be the best strategy), I got this:
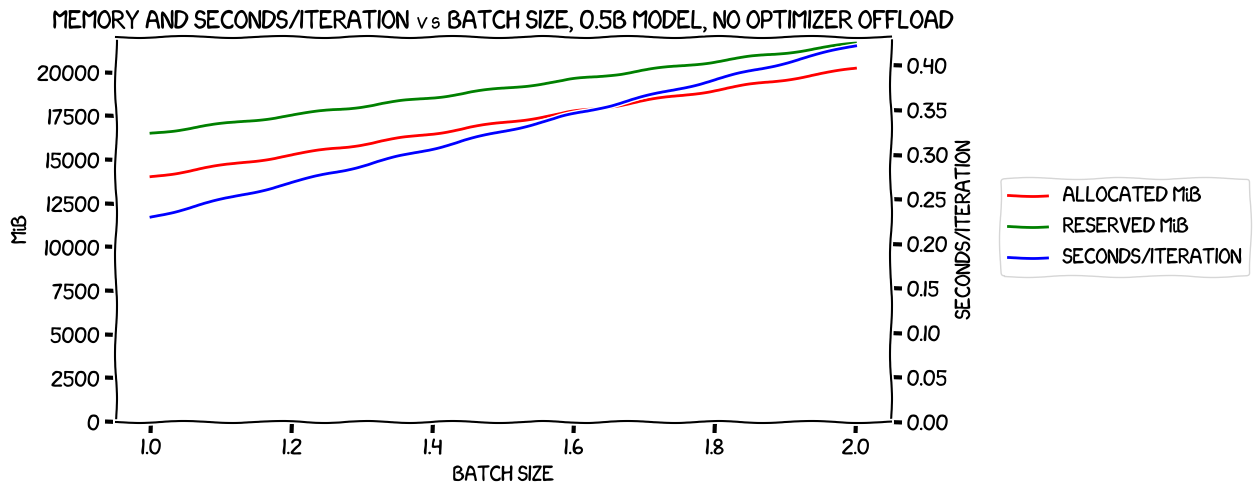
(All analysis and charting code is in this notebook.)
As you can see, it got up to a batch size of 2 before it ran out of memory on my 24 GiB card. That was better that I remembered managing before, but on looking back at the blog post in question I realised that at the time I had been using an evaluation batch size of twice the training one (copy/paste from some code from the Fast.AI course), and so I'd been running out of memory at the mid-train eval.
Now, of course, that doesn't tell us anything about whether or not the relationship between batch size and memory usage or speed is linear, because with only two data points the line between them will always be straight.
So the next test was with the optimizer offloaded:
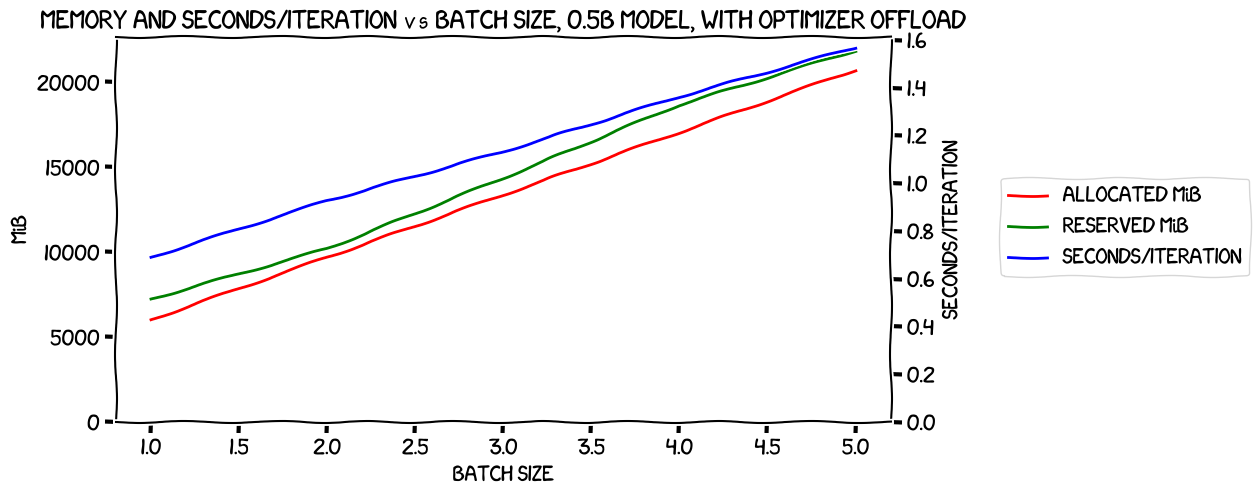
This time I was able to get up to a batch size of 5, and it really does look pretty linear -- my choice of using seconds/iteration rather than iterations/second in both this and the previous graph was because I figured it would be easier to see a linear relationship in time taken that way.
So, to compare the memory usage between the two options, with and without optimizer offload, I decided to take a look at the reserved memory usage:
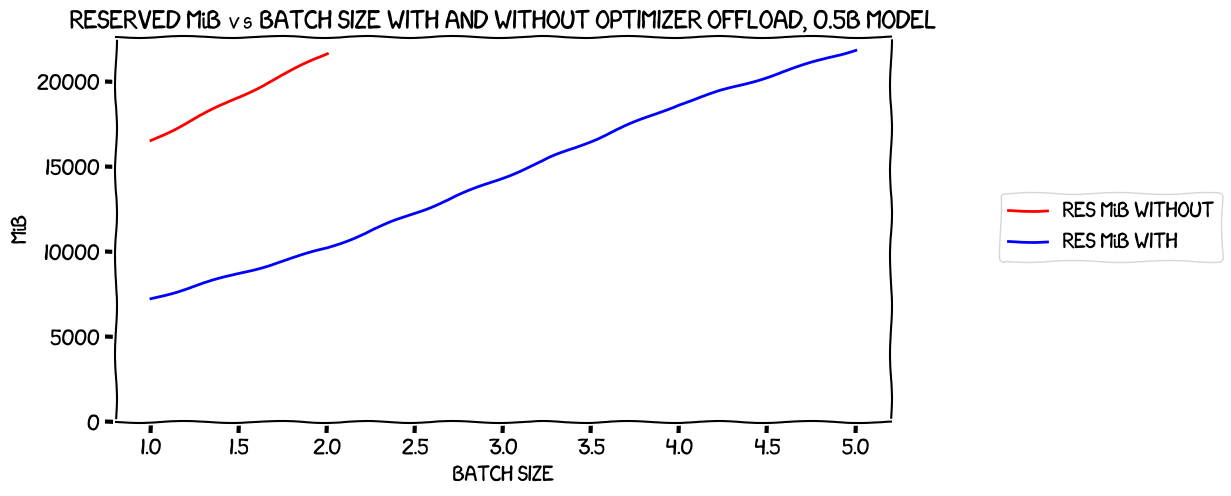
Nothing terribly interesting there; how about speed? One thing I wanted to consider: while training with the optimizer offloaded was definitely going to be slower in terms of how long it would take to run each iteration, it did allow larger batch sizes. Was it possible that the latter might compensate for the former and training with the optimizer offloaded could be faster? I added on two extra columns to each of my two dataframes, the one with the results for the test with no optimizer offload, and the one with the data with the optimizer offloaded:
- The number of iterations: this was the total number of samples in my training set, 19,692, divided by the batch size.
- Seconds to complete: this was the number of iterations divided by iterations/second.
I then plotted the seconds per iteration (remember, inverting the raw number to make it linear) for both of the tests against each other, along with the seconds to complete, with a horizontal line for the fastest time to complete predicted for the no-offload run. If the seconds to complete line for the optimizer offloaded results ever went below that line, it would show that the increased batch size it made possible would more than offset the performance hit from the offload.
Here's what I got:
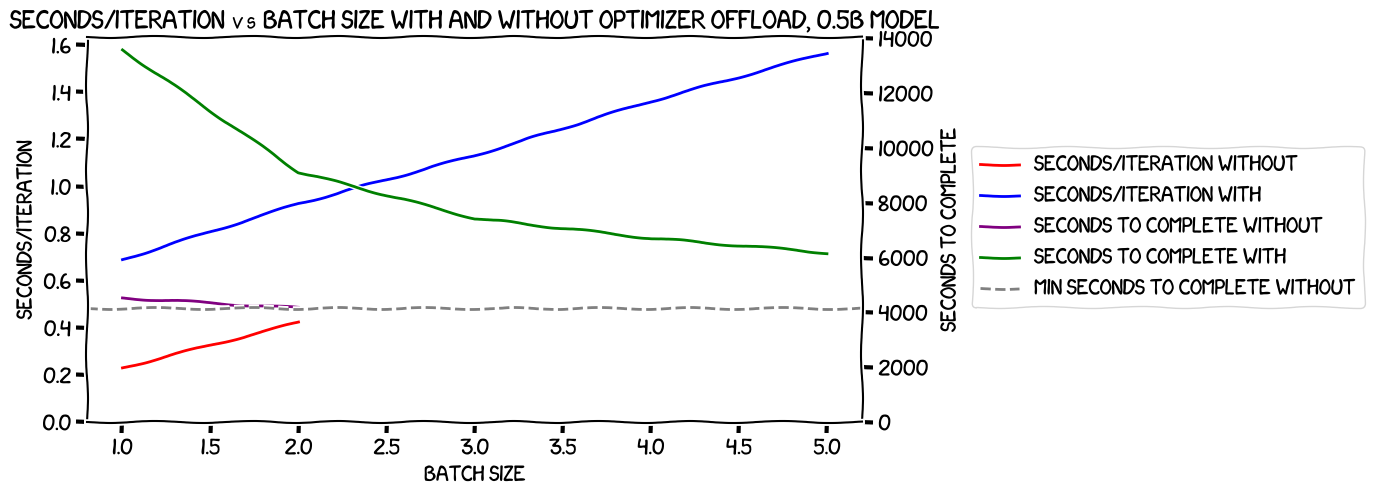
Pretty clearly, the slowdown caused by offloading the optimizer was large enough that the increased batch size it made possible could never make up for it, at least with this model and hardware setup. That's pretty much what I'd expected, but it was good to have it confirmed.
Next, it was time to try the same tests with the larger model.
Testing with the larger model, in the cloud
I made yet another copy of the two scripts, and kicked off the no-optimizer-offload one on an 8x A100 80GiB machine on Lambda Labs.
While it was running, I double-checked
one thing. The parameter I was setting for the batch size was per_device_train_batch_size.
I assumed that this meant that it would be training with a batch size of 8 (one
sample per GPU) but wanted to confirm. As the training loop prints out its progress
while it's running, I could see how many iterations were remaining right at the
start. When it was running the first one, with a batch size of one "per device", I saw that
there were 2,462 to go; with 19,692 samples in the training set, that matches
an overall batch size of 8. Likewise, when it got on to testing with a batch
size of two, there were 1,232, which worked for an overall batch size of 16. So
that was good to have confirmed.
I ran both the with and without optimization offload tests, and it was time to do some charting again. I had to do the same massaging of the data as last time around to make sure that I had one row in the dataset for each batch size, with all of the per-GPU numbers in it, and to work out the max/min/mean values for both kinds of memory -- that was just a copy/paste of the code from the last blog post. However, I also made one change to the data -- I multiplied all of the batch sizes by 8 to reflect the overall batch size -- this was to make the later time-to-completion comparisons a bit easier to do.
Here are the basic numbers for the run without the optimizer offload:
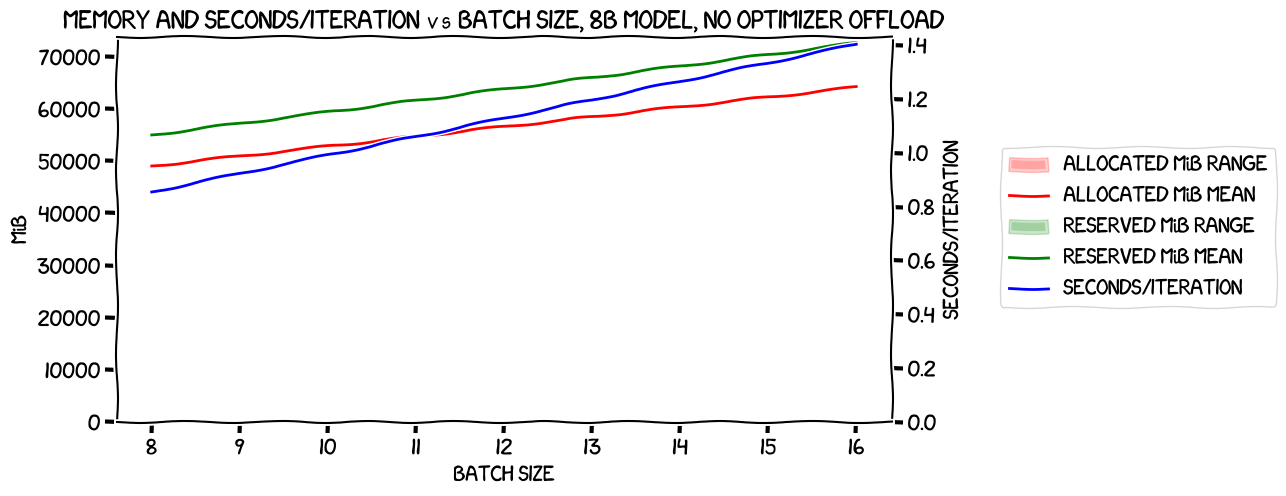
As you can see there were just numbers for batch sizes of 8 and 16, corresponding to per-device batch sizes of 1 and 2. Nothing particularly interesting here, apart from the (compared to last time) significantly tighter ranges of the memory usage across the GPUs. There was much more variance in the previous tests. I'm not sure why this might be.
Now, the results with the optimizer offload:
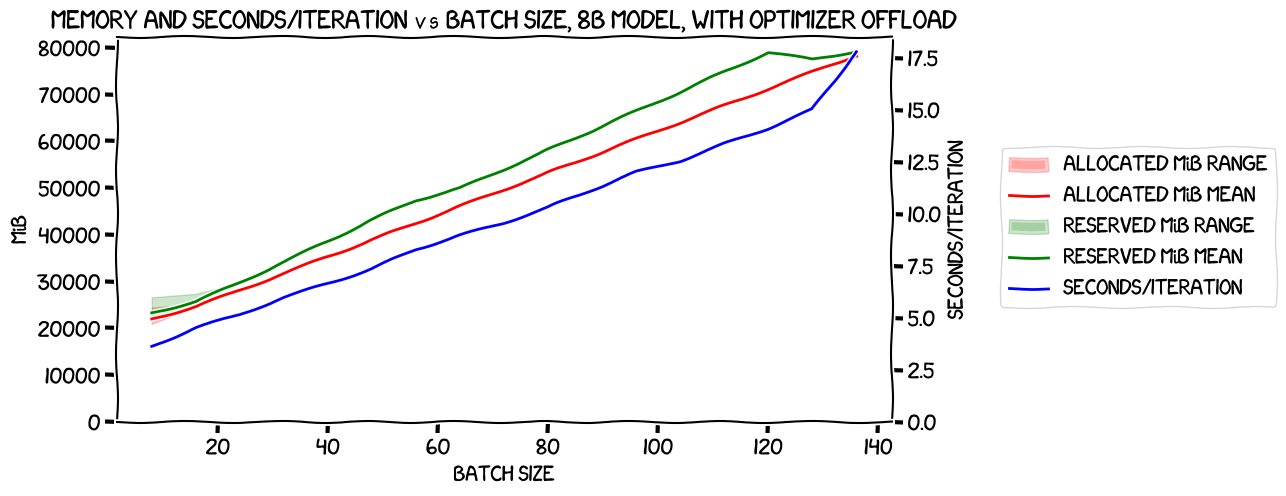
Here we were able to get up to a per-device batch size of 17. You can see that the same tighter cross-GPU memory usage happened again (though there was more variance at a batch size of one). It's also very noticeable that the last two runs, with batch sizes of 16 (128 overall) and 17 (136 overall), hit a wall with the amount of VRAM they could use, and at least for the batch size of 17, that had a significant impact on performance -- the previously linear relationship between batch size and seconds/iteration suddenly kinks upwards for that last data point.
So, what about the comparison between the two runs? Firstly, memory usage:
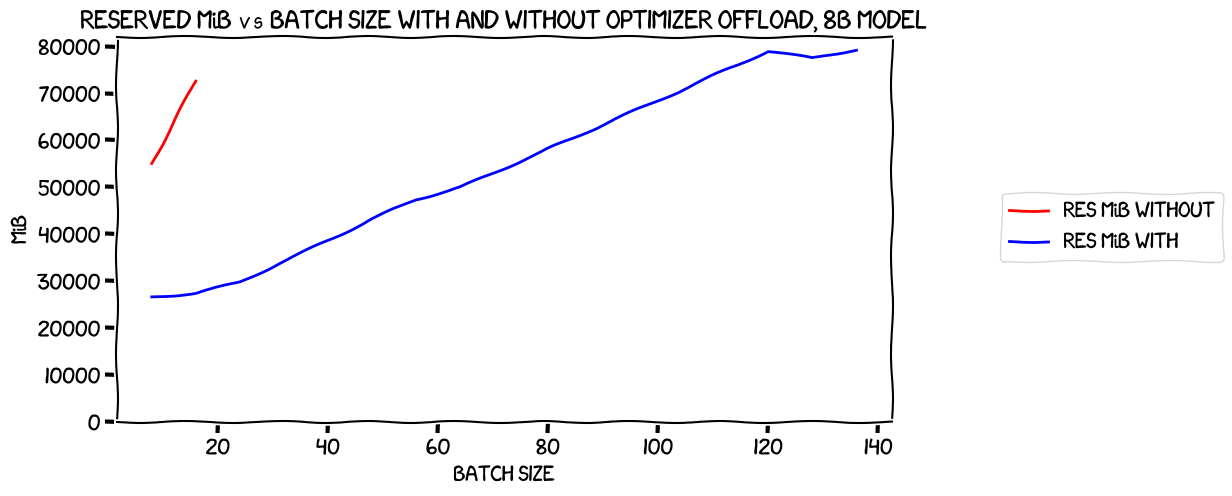
Nothing interesting there; as expected, the line without the optimizer offload is higher and steeper than the one with the offload. More interestingly, the speed:
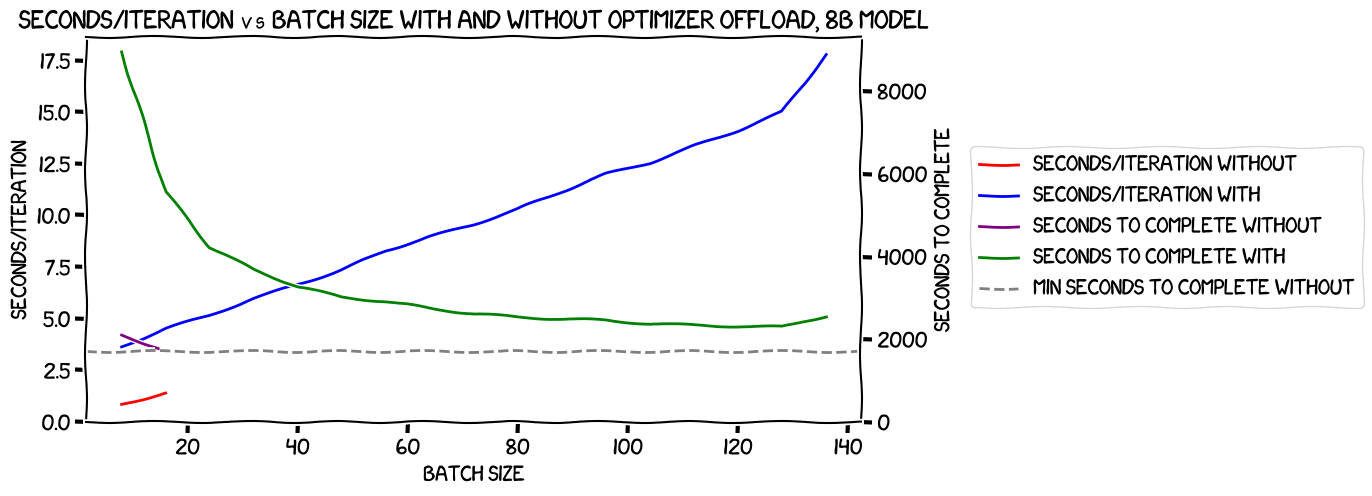
Once again, the run without the optimizer offload wins; while the line showing seconds to completion for the run with the optimizer offloaded was falling slowly towards the best-case number for the run without (apart from the upturn caused by the memory issues with a batch size of 17), it never got there. It would be interesting to see if it ever did get there with sufficient memory -- I imagine it would, though of course if we had more memory then the batch size without the optimizer offload would be higher too, so offloading would still be a worse option.
Conclusion...?
By this time I felt I had reached a solid conclusion, but I wanted to do the basic calculations to check. To train the 8B model on a 8x A100 80GiB machine, I calculated that it would take:
- Without the optimizer offload, with a batch size of two, about 29 minutes.
- With the optimizer offload, with a batch size of 16, about 40 minutes.
I was planning to stop with that, and write up this experiment, but then something interesting cropped up.
Liger kernel
While I was writing things up, I saw a post from Byron Hsu on X about Liger Kernel. This is a set of alternative CUDA kernels that apparently can improve multi-GPU training throughput by 20% and memory use by 60%. What's more, switching to using them requires just a single line code change for Llama models. It definitely sounded like I should take a look before posting!
I spun up an 8x A100 8GiB machine again, cloned my repo, and installed my standard
requirements into a virtualenv. I then tried a pip install liger-kernel, but there were clashes
with the pinned versions I had installed, so I decided to keep things simple,
delete the env, create a new one, and install the packages I needed without
specified versions so that pip could sort things out:
pip install torch datasets 'transformers[torch]' deepspeed liger-kernel
Once that was done, I edited measure_memory_usage_for_batch_size.py -- the script to
test with the optimizer not offloaded -- and added this import:
from liger_kernel.transformers import apply_liger_kernel_to_llama
...and then, just after the model is created, added:
apply_liger_kernel_to_llama()
Then I ran:
python measure_memory_usage.py
And a little wile later it hit an OOM -- it didn't exit, however -- the OOMed process did but the others just sat there spinning their wheels. Still, ^C worked and in the result file I could see that it had reached a batch size of three -- definitely a win! However, charting it led to less good news:
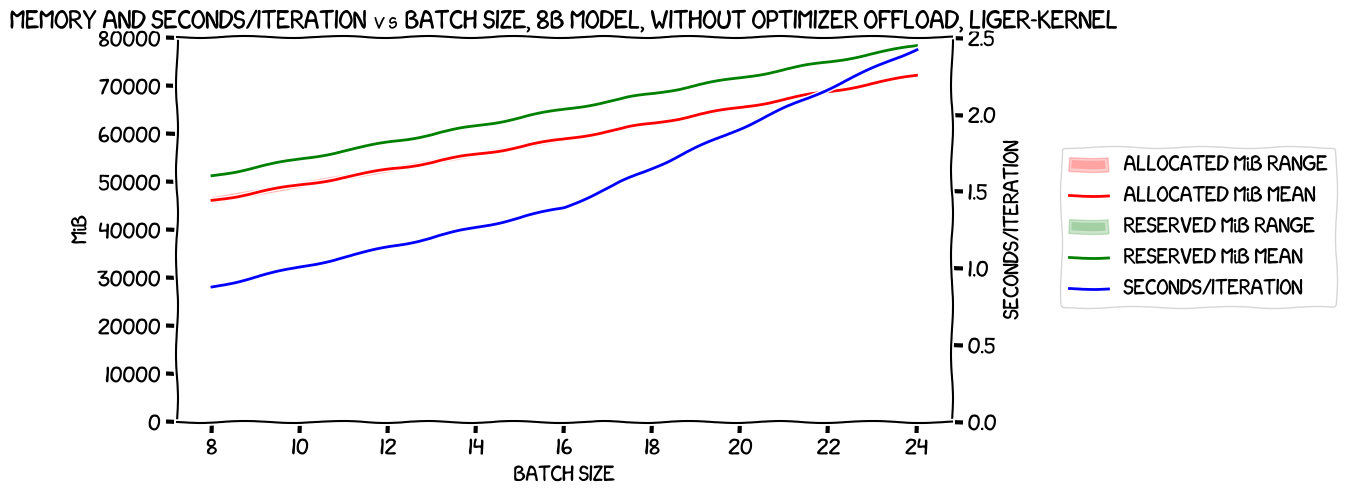
The seconds/iteration is significantly worse for the batch size of three. Still, focusing on memory usage alone, here's how it compared to the run without Liger Kernel:
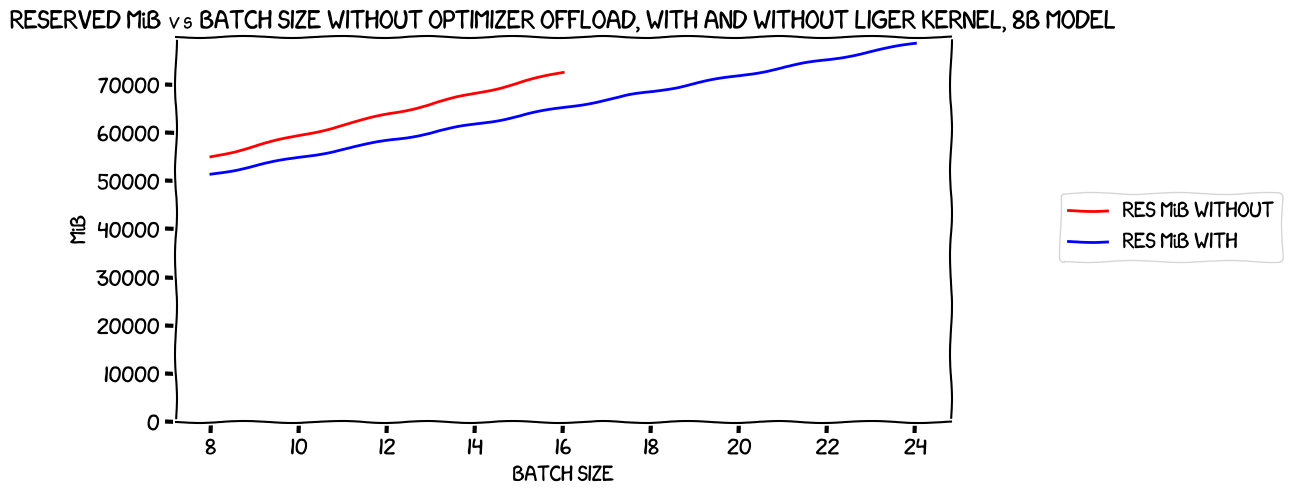
There's definitely a saving there, though it's more like 10% at a per-GPU batch size of 1, and somewhat more at 2.
Now let's look at the speed:
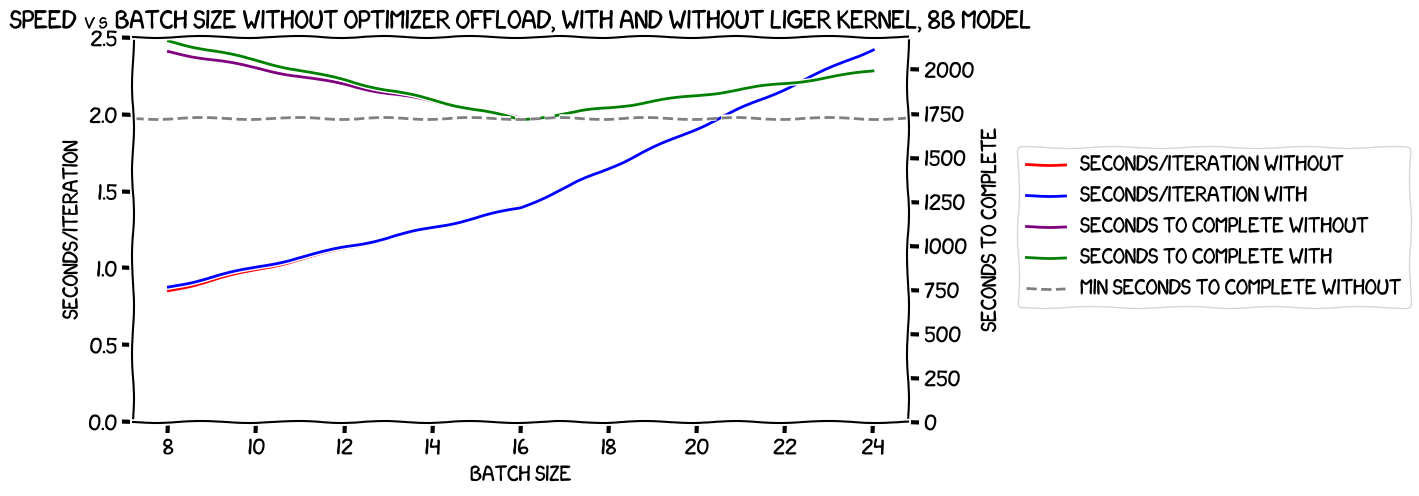
The seconds/iteration are essentially the same both with and without Liger Kernel for the two batch sizes that we have numbers for, and then there's that disproportionate increase at the per-GPU batch size of 3. And you can see the harm that does in the seconds to complete numbers -- the line "bounces off" the horizontal line I've put at the number for the batch size of two, and even though we were able to squeeze in that extra batch, the overall train would be slower.
I posted about this on X, and Byron kindly commented to suggest what might be the cause: my batch size is small enough that the GPUs' streaming multiprocessors may not be being fully utilised, so I'm not getting as much benefit as I should from the alternate kernels. However, those kernels do have an associated overhead that is greater than the default kernels', so I'm paying the price for that.
So that led me naturally on to the next experiment (though TBF I would have done that anyway); what happens with the optimizer offloaded? I still didn't expect that to beat the non-offloaded numbers, but perhaps Liger Kernel's benefits would be more obvious there.
This was an expensive test to run; 10 hours of machine time at $14.32/hour. But I figured it would be worth it to see some real numbers. Here's what I got:
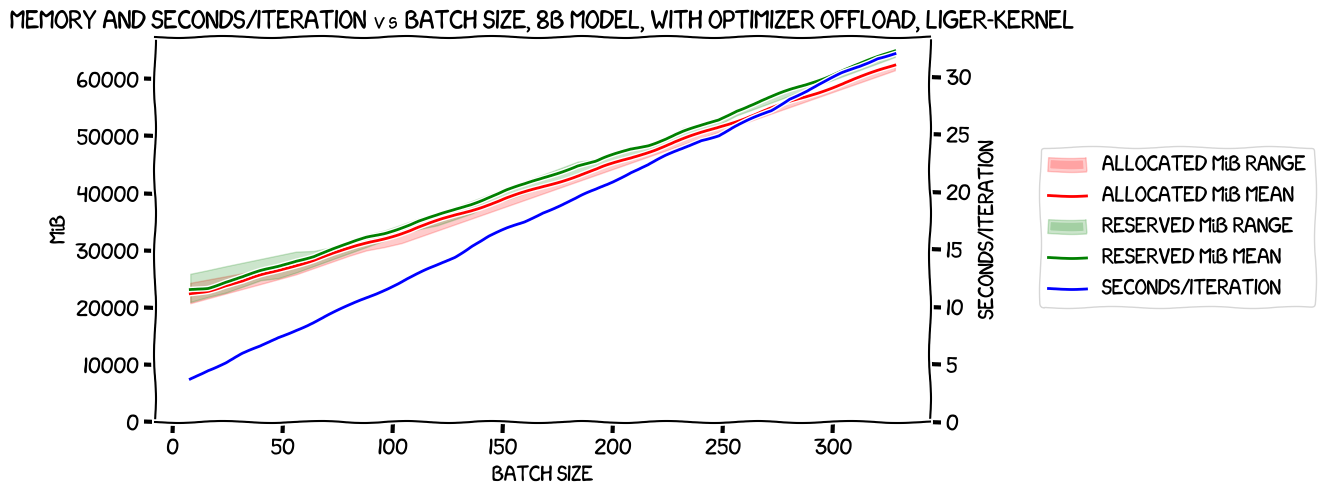
I was able to get all the way up to a per-GPU batch size of 41 (as compared to 17 without Liger Kernel), and seconds/iteration was still linear. That's a huge improvement! And that's even despite the fact that for some reason it OOMed at 60GiB usage per card. I'm not sure why that was, but this was getting expensive and I decided not to dig into it.
A chart of the memory usage with the optimizer offload with and without Liger Kernel makes the improvement even more obvious:
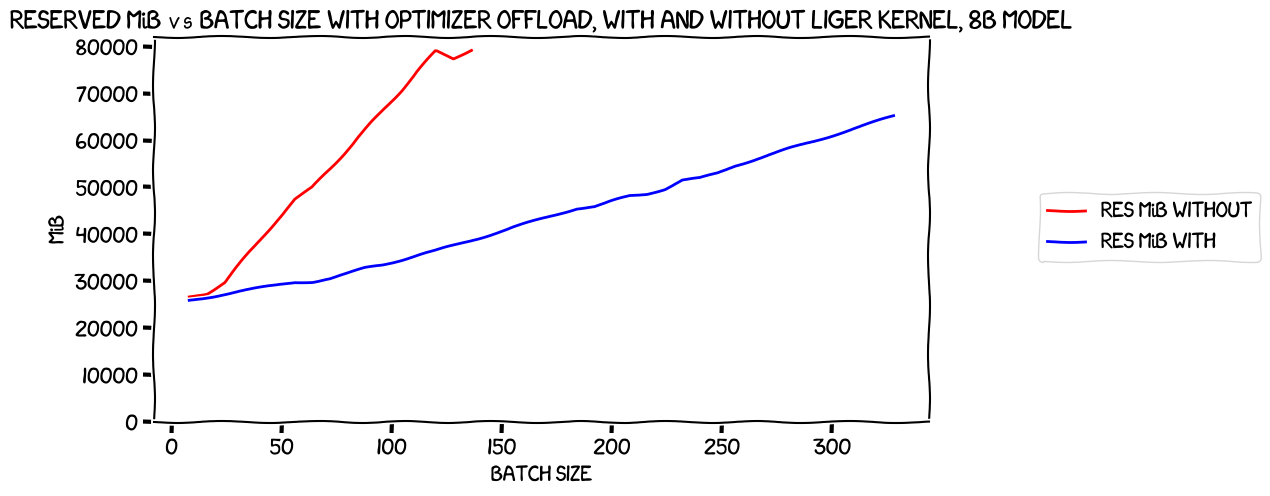
That is a massive improvement in memory usage, and it only seems to get better with increasing batch size. How about speed?
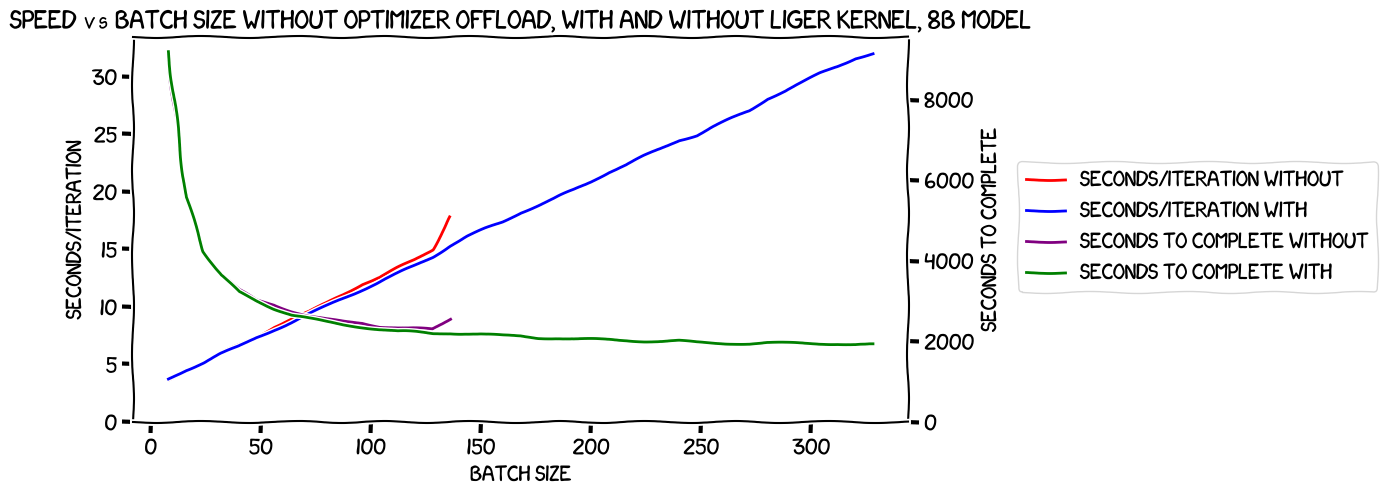
No obvious improvements there, sadly; if we disregard the last point on the no-Liger-Kernel chart, they're essentially the same.
But the big question in my mind was: would the increased batch size I could get with Liger Kernal mean that the optimizer-offloaded run could have a large enough batch size that it would outperform the fastest option I had so far -- the ones with the optimizer not offloaded, and a per-GPU batch size of 2? Here's the chart:
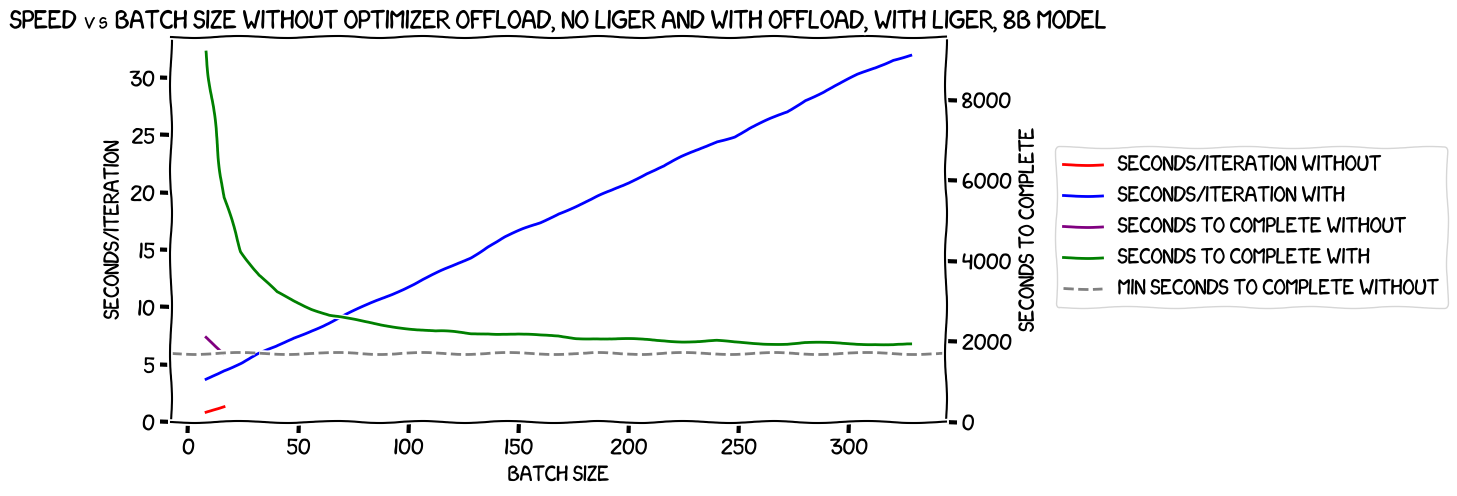
Sadly not :-( Indeed, it looked almost as if it was asymptotically approaching the same speed, but it was always slower.
Conclusion (really this time)
Liger Kernel was a really interesting side quest, but in terms of my particular experiment it looks like it doesn't help. Its value really kicks in as the batch size gets larger, and -- because I'm training an 8B LLM on a machine that is only capable of doing a per-GPU batch size of two -- I can't use it. If I were doing LoRA, smaller sequence lengths, or something else less memory-hungry, I'm sure it would be really helpful, though, and it's great to know it's there when I need it.
But for now, I think I'm finally in a place where I can do what should be the last experiment in this series: a full fine-tune of the Llama 3 8B base model -- on the openassistant-guanaco dataset, without using tricks like quantization or LoRA.